Arctic Sea Ice Melt Continues


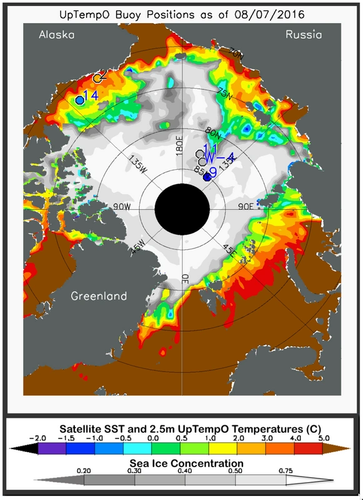 Average sea surface temperature measured by satellites using thermal emission sensors, which produce global data adjusted after comparison with ship and buoy data, and sea ice concentration derived from NSIDC near-real-time data for August 7, 2016. Also shown are drifting buoy temperatures at the ocean surface (colored circles); gray circles indicate that temperature data from the buoys are not available. (Credit: M. Steele, Polar Science Center/University of Washington)
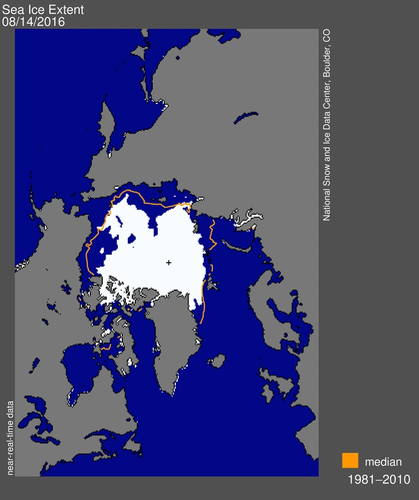 Arctic sea ice extent for August 14, 2016 was 5.61 million square kilometers. The orange line shows the 1981 to 2010 median extent for that day. The black cross indicates the geographic North Pole. Sea Ice Index data. (Credit: NSIDC)
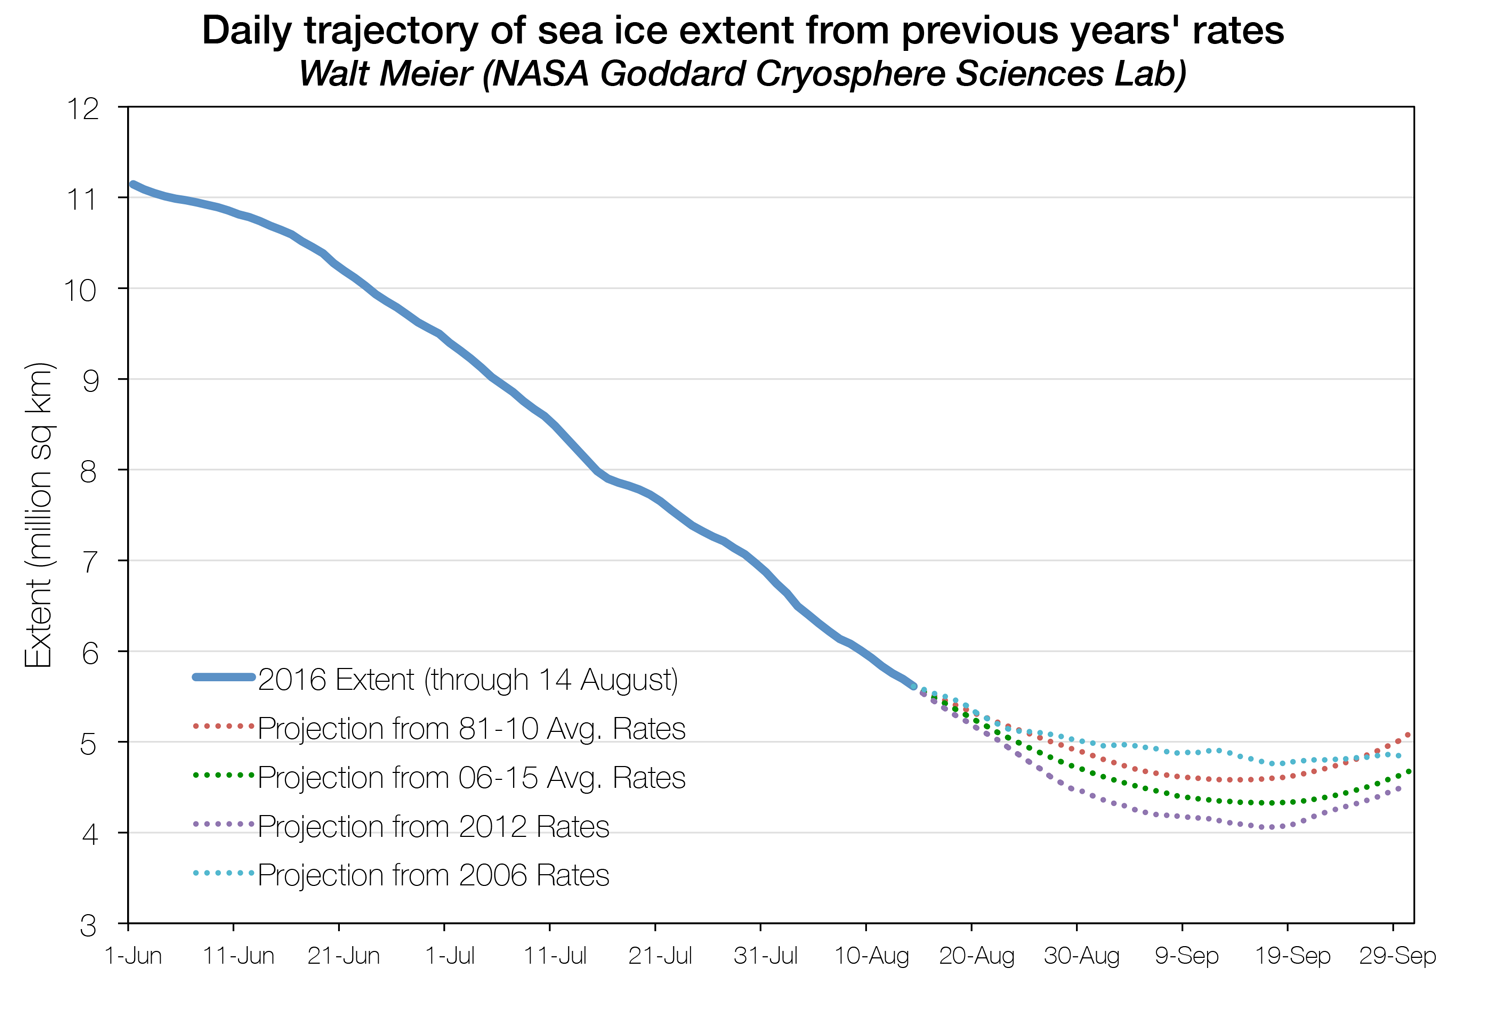
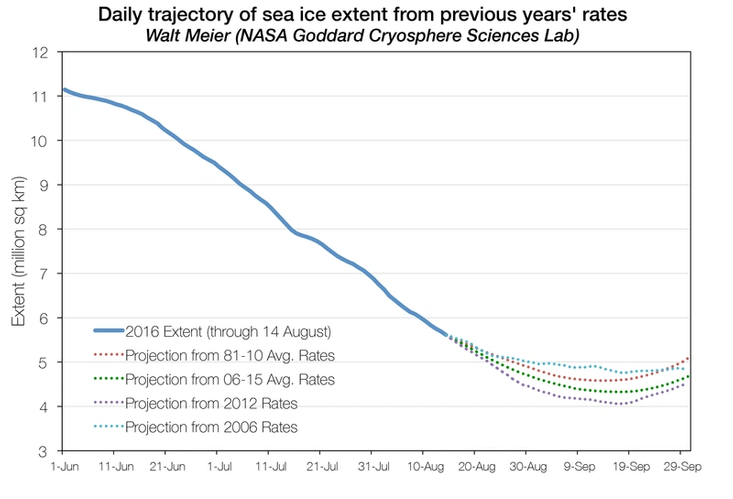 Projections of ice extent from August 14 through September 30 based on previous years’ observed retreat rates appended to the August 14, 2016 ice extent. (Credit: W. Meier/NASA GSFC)
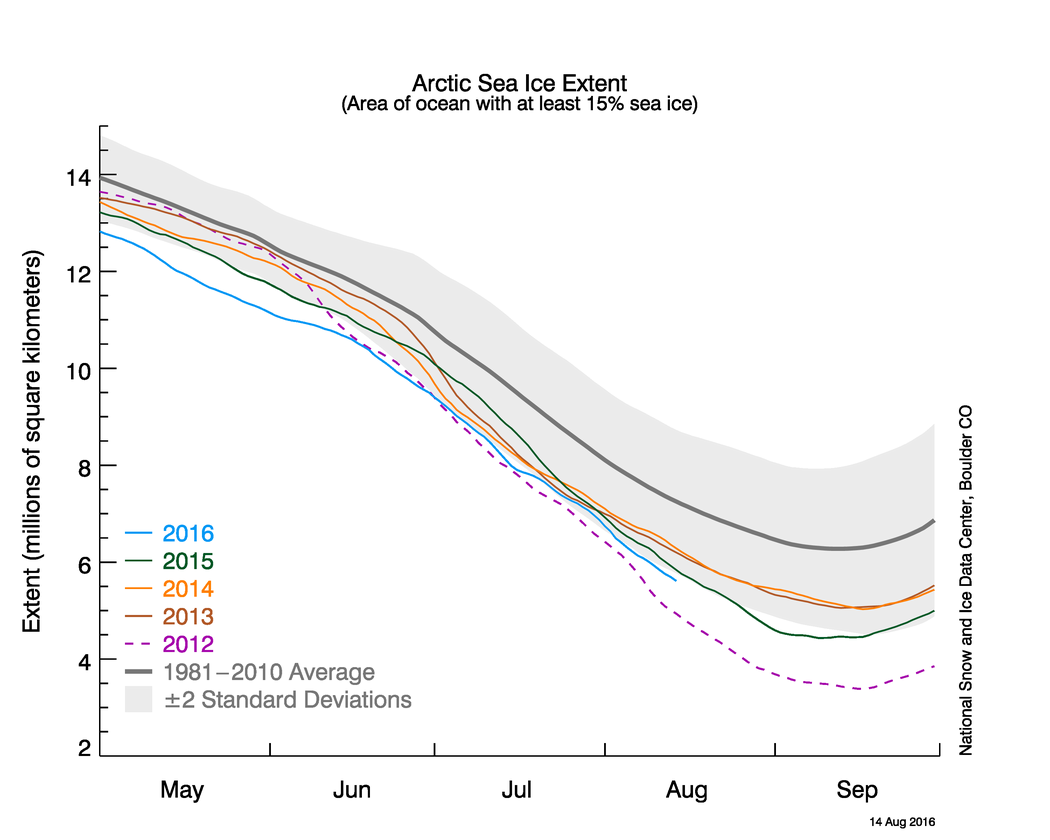
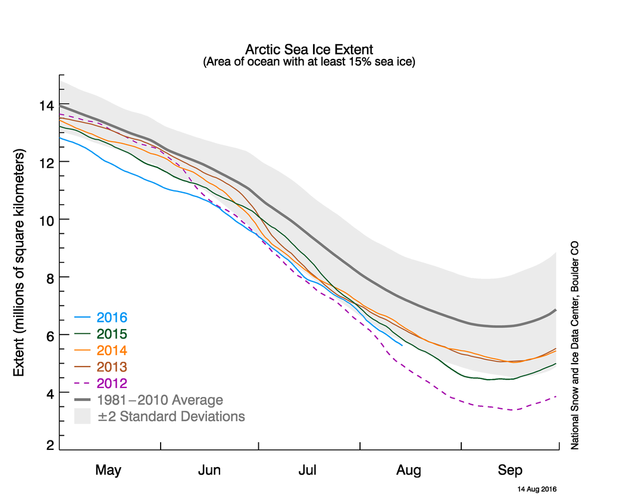 Arctic sea ice extent as of August 14, 2016, along with daily ice extent data for four previous years. 2016 is in blue, 2015 in green, 2014 in orange, 2013 in brown, and 2012 in purple. The 1981 to 2010 average is in dark gray. The gray area around the average line shows the two standard deviation range of the data. (Credit: NSIDC)
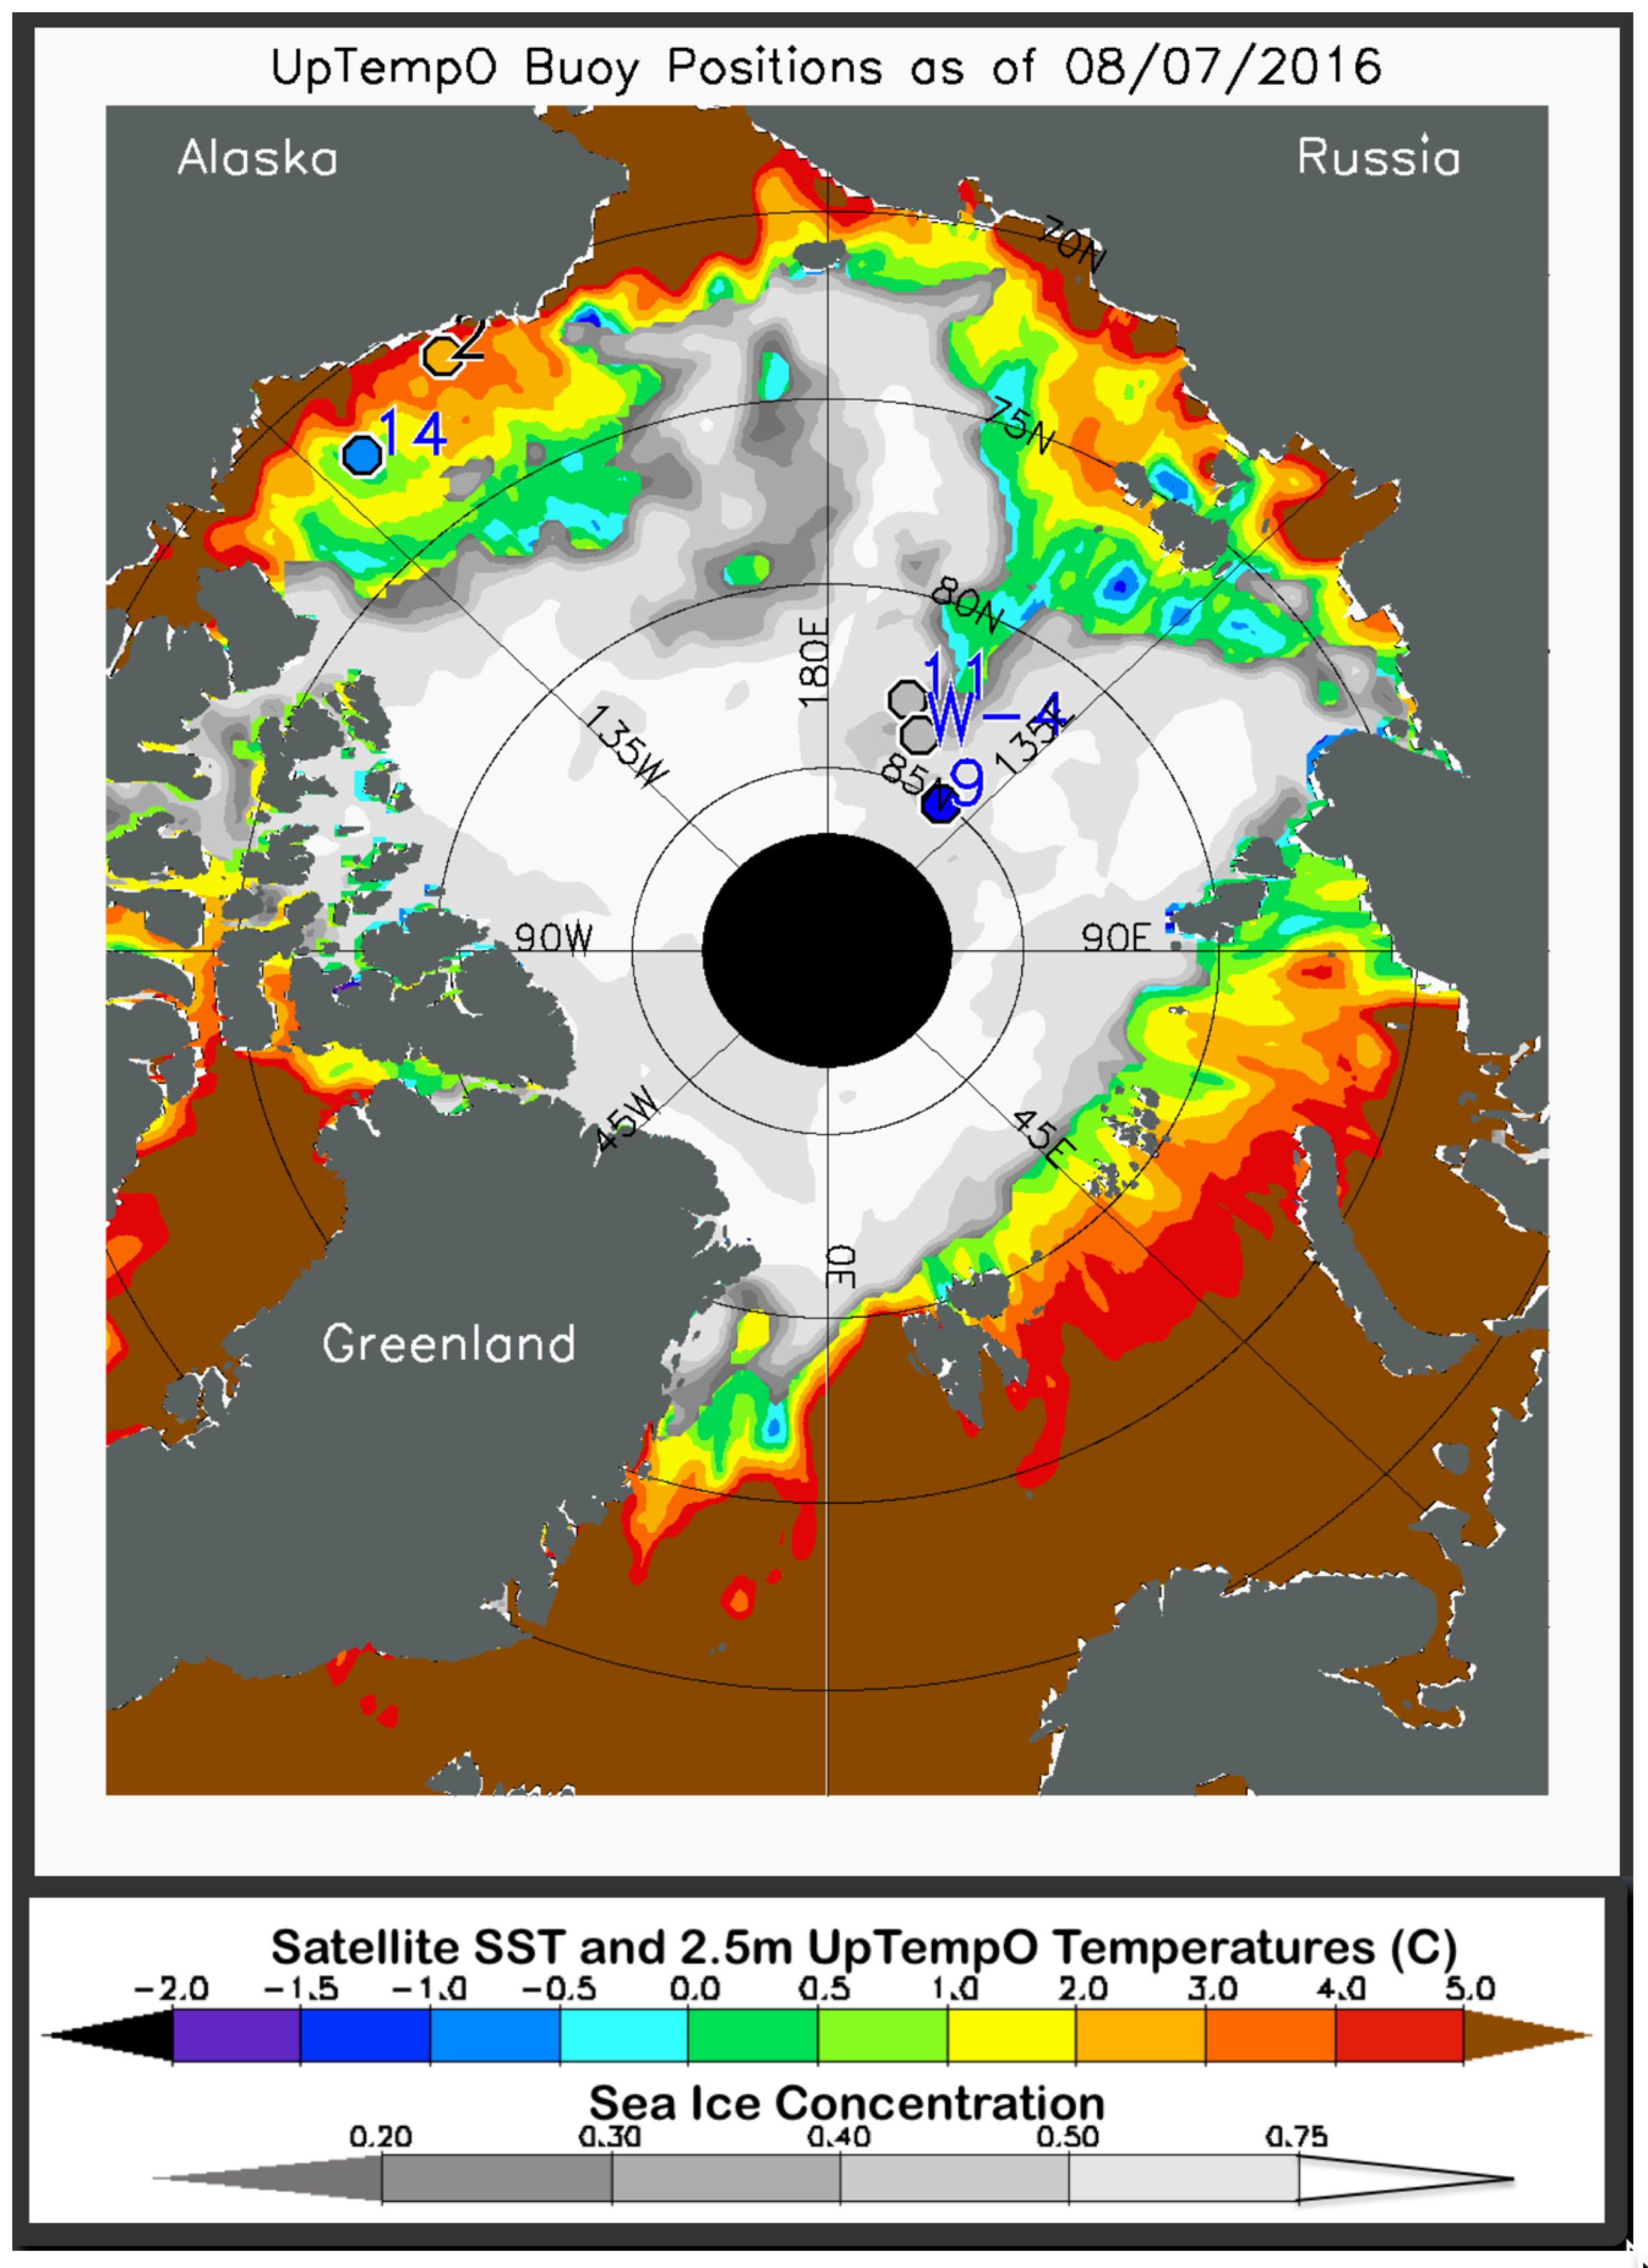

As of August 14, Arctic sea ice extent is tracking third lowest in the satellite record, according to the National Snow & Ice Data Center (NSIDC). The southern route through the Northwest Passage appears to be largely free of ice. Despite a rather diffuse ice cover in the Chukchi Sea, it is unlikely that Arctic sea ice extent this September will fall below the record minimum set in 2012.
Overview of conditions
As of August 14, Arctic sea ice extent was 5.61 million square kilometers, the third lowest extent in the satellite record for this date and slightly below the two standard deviation range. So far this month the rate of loss has been faster than average and has declined at a rate similar to that observed for 2012.
Ice loss has progressed quite rapidly in the Beaufort and Chukchi seas, where broken up ice floes are starting to melt away. However, large, thick multiyear ice floes persist in several areas; it remains to be seen if they will survive the melt season. A wedge of open water has also penetrated northward from the East Siberian Sea, yet ice remains extensive in the Laptev Sea, blocking the Northern Sea Route. Ice extent continues to be low in the Kara, Barents, and East Greenland seas. The southern (Amundsen’s) route through the Northwest Passage appears open in Advanced Scanning Microwave Radiometer 2 (AMSR2) data. However, data in visible wavelengths from the NASA Moderate Resolution Imaging Spectroradiometer (MODIS) instrument still show some ice.
Conditions in context
Ice loss from August 1 to 14 was faster than average, at 87,400 square kilometers per day, and near the rates observed in 2012. Nevertheless, as has been the pattern this summer, atmospheric conditions through the first half of August have been generally cloudy and cool. Air temperatures at the 925 hPa level were 1 to 3 degrees Celsius below the 1981 to 2010 long-term average over the eastern part of the Arctic Ocean and near average elsewhere. The cool and cloudy conditions reflect a pattern of low atmospheric pressure over the Laptev and Kara seas.
As of August 16, a strong storm (central pressure of 968 hPa) was located over the Central Arctic Ocean at about 85 degrees North, near the dateline. The extent to which this strong storm will affect sea ice conditions remains to be seen, NSIDC said.
Ocean heat continues ice melt
The Arctic atmosphere is cooling now as the sun dips lower in the sky. However, sea ice loss will continue throughout August due primarily to melt from the ocean heat that has accumulated over the summer. Early ice retreat has allowed the ocean to warm, both from absorption of the sun’s energy and from northward-flowing warm water in the Chukchi Sea to the west of Alaska and in the Barents Sea to the north of Norway. Unusually strong ocean warming occurred in northern Baffin Bay (between northern Canada and Greenland), the Beaufort Sea (north of northwestern Canada and Alaska), the East Siberian Sea (north of far eastern Siberia) and the Barents and Kara seas (north of western Eurasia).
What is quite unusual this year is the early ice retreat and resulting ocean warming in the western Beaufort Sea and in the western East Siberian Sea. The extent of warming to the north of these two seas is also unusual, as well as the extent of this warming to the north. These two areas typically melt out later in the season, when atmospheric heating rates have declined from their mid-summer peak. Thus the exposed ocean warms, but not all that much. This pattern was true during the record-setting year of 2012, when by the end of summer, these areas were substantially cooler than surrounding seas that had melted out earlier.
This year, however, the melt out was early and extensive enough that the ocean has already warmed substantially in these two areas. More sea ice retreat is probable in the western Beaufort and East Siberian seas as well as areas in the coming weeks. But what about the ocean’s response? Some warm water might move northward via ocean currents and contribute to ice melt. However, further dramatic ocean surface warming is unlikely, given that the atmosphere is already cooling, especially in far northern latitudes.
Ice loss rates indicate little chance for a record low this year
While there are still three to four weeks to go in the melt season, a new record low this September is highly unlikely. A simple projection method developed by Walt Meier at the NASA Goddard Space Flight Center uses daily ice loss rates from previous years to estimate possible trajectories of ice extent through the rest of the melt season.
This approach yields a range of minimum values based on how sea ice loss progressed in previous years. By selecting from an average of multiple years, or using loss rates from a specific previous year, the method yields an estimate of the likely range of the minimum sea ice extent. As of August 14, using daily ice loss rates based on the 2006 to 2015 average yields an average projected 2016 minimum extent of 4.33 million square kilometers. Using the slowest (recent) August to September decline, which occurred in 2006, yields a 2016 minimum of 4.76 million square kilometers. Using the fastest rate of decline, from 2012, yields a 2016 minimum extent of 4.06 million square kilometers. These two years bracket a reasonable range of expected 2016 minima. It is possible that this year will have decline rates that fall outside the range of previous years. However, this approach indicates that it is very unlikely that 2016 will have a minimum below 2012’s value of 3.39 million square kilometers.
(Source: NSIDC)