Middle East Gulf Exports Soar in January 2017


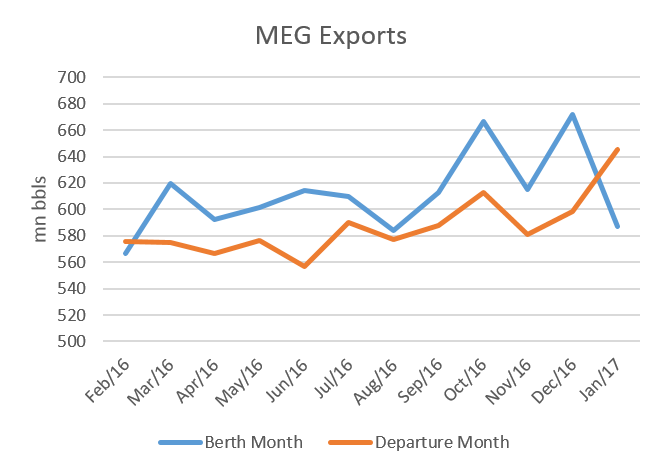 Middle East Gulf region crude oil exports by berth month and departure month from February 2016 to January 2017. (Image: Genscape)
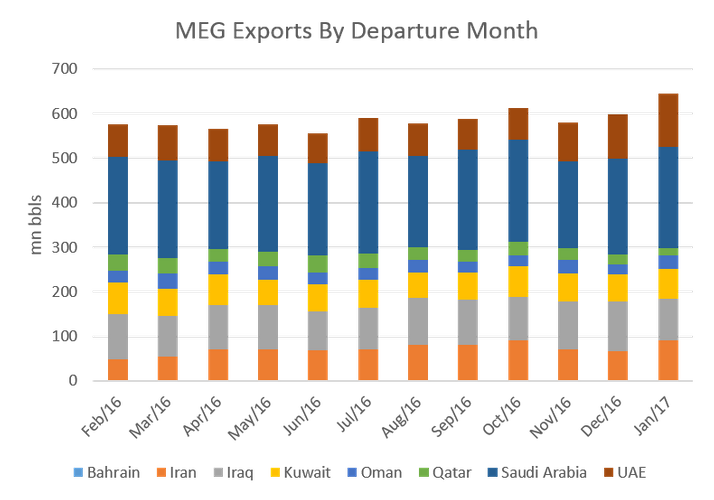 Middle East Gulf crude oil exports by departure month for Bahrain, Iran, Iraq, Kuwait, Oman, Qatar, Saudi Arabia, and UAE, from February 2016 to January 2017. (Image: Genscape)
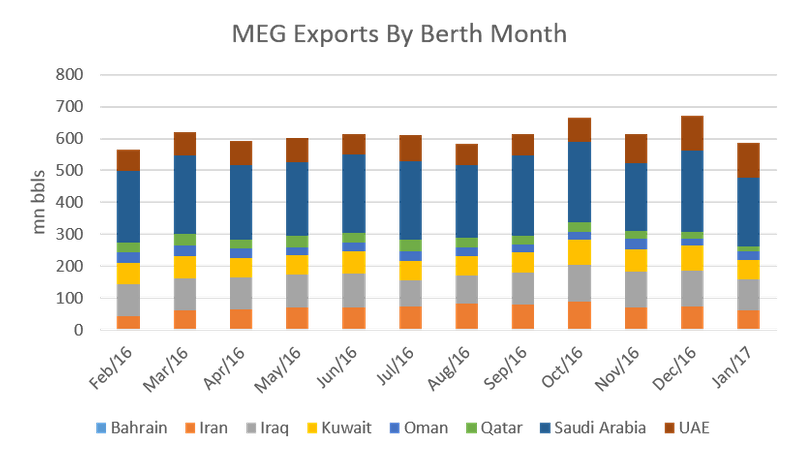 Middle East Gulf crude oil exports by berth month for Bahrain, Iran, Iraq, Kuwait, Oman, Qatar, Saudi Arabia, and UAE, from February 2016 to January 2017. (Image: Genscape)
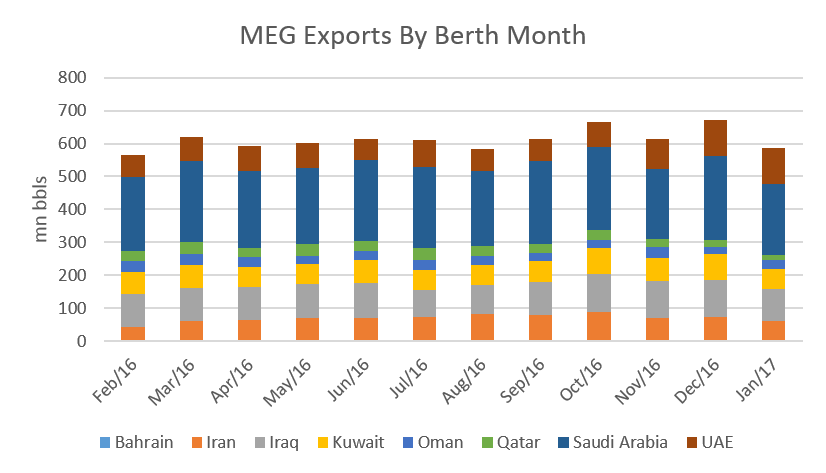


During January – a month when all eyes were on oil production cuts – exports leaving the Middle East Gulf (MEG) region hit the highest level in at least two years, according to Genscape. At the end of November 2016, the Organization of the Petroleum Exporting Countries (OPEC) addressed the perceived global oversupply of oil and consequent low prices. OPEC members agreed that all countries, except Iran, would cut total production by 1.2 million barrels per day (bpd), starting on January 1.
In addition, 10 days later, a group of 11 non-OPEC oil-producers, led by Russia, arrived at an agreement to ease their production in 2017 by another 558,000 bpd.
The effects of the OPEC-non-OPEC deal were immediate, and oil prices jumped quickly in response to the agreement, with the benchmark Brent price for January moving from $46.38/bbl to $50.47/bbl, or an 8.82 percent gain between November 20 and November 29, 2016.
Recent surveys suggest that Saudi Arabia’s crude production fell by around 470,000 bpd in January to just under 10 million bpd, while Russia shaved its output by 10,000 bpd to 11.1 million bpd last month.
Genscape’s monitoring of exports leaving the MEG region revealed two developments in January, which at first glance seem contradictory but are believed by Genscape to be complementary.
When measured by the date of departure from the region, MEG exports rose to the highest levels in the last 12 months. Genscape calls this the “Departure Month,” which is the month during which a vessel declared a destination and signaled its intent to leave the region.
However, when measured by the date of each vessel’s arrival, the Berth Date, at a crude loading facility, output fell in January compared to December 2016. The difference between Berth Month and Departure Month is essentially the difference between what loads and what leaves (see chart). The distinction has been important because often vessels linger in the MEG for some days for operational reasons, or at times may linger for months. Any delay over seven days is typically considered to be floating storage.
A further analysis of the differences between the departures in a given month and the load berth dates shows that typically seven to ten percent of the departures are loaded the previous month. These are normal operational delays. Starting in November 2016 that percentage started increasing. In December’s departures, just over 10 percent had been loaded the month before, but Genscape also saw loadings from as far back 2013, which were clearly floating storage beginning to be cleared out. For January, more than 21 percent of the departures had been loaded in months previous, and again much of that coming from months old floating storage.
January Exports Surge
MEG Exports based on Departure Month shows that more crude left the MEG region in January than in any month in 2016. January saw an eight percent month-on-month rise in crude cargoes leaving MEG, with 645 million bbls leaving in the first month of 2017, compared to 598.4 million bbls in December (see chart). Crude oil prices are currently about 19 percent higher than before the OPEC deal was signed in November and at their highest level in 18 months. The large increase in tankers leaving the MEG in January suggests Middle East producers are attempting to monetize the increase in the oil price before production in other countries – which are not party to the OPEC-non-OPEC deal -- notably the United States -- rise as higher oil prices prompt more drilling and investment and therefore oil production – which can be ramped-up very quickly in many of North America’s onshore shale plays.
Genscape monitored data of U.S. storage levels in PADD 2 and 3 showed that crude oil inventories rose again in the week ending February 3, by 3.8 million bbls from 195.6 million bbls to 195.4 million bbls, a trend which has already started to weigh down on the benchmark crude oil prices. Genscape monitors approximately 45 percent of U.S. storage capacity.
Vessels Arriving in MEG Drop
Nevertheless, Genscape data based on Berth Month suggests the 2016 MEG crude supply-demand imbalance is correcting itself. MEG Exports based on Berth Month, reflecting the date a vessel arrives at its loading berth, are down significantly in January, slumping from 672.1 million bbls to 587.3 million bbls, or 12.6 percent from December (see chart). The data suggests that either demand is down, production of crude in the MEG region has dropped, or there is a combination of both.
On February 17, 2017, the committee responsible for monitoring compliance relating to the OPEC production cut agreement will publish its first report on the progress of the deal. OPEC members are then scheduled to meet in May where the possibility of extending the production cuts into the second half of the year will be discussed. Nevertheless, if non-OPEC countries that are not currently cooperating with OPEC, notably the United States, continue to ramp-up production, another crude supply overhang could swiftly result. Production in the U.S. Permian Basin, one of the best economic plays, is expected to grow from 2.1 million bpd to 2.8 million bpd by year end 2017, according to a February 6 Genscape production forecast.
Genscape's Middle East Waterborne Crude Report provides insight and analysis to assist with forecasting price shifts by anticipating crude flows from the Middle East. Our breadth of proprietary data and trusted market intelligence to understand the movement of crude across global markets. It is produced by leveraging data from Genscape Vesseltracker, which shares the most comprehensive and accurate picture of global ship movements. To learn more about Genscape's Middle East Waterborne Crude Report, or to request a free trial, please click here.
The Author
Matthew Wheatley is an oil shipping analyst at Genscape.