Low Tanker Rates Boost Long-distance Trade -EIA


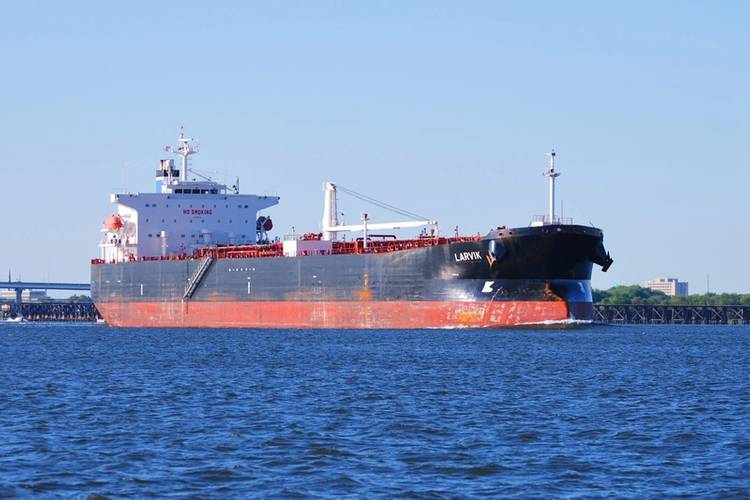 File photo: Robert Hendry
 Source: U.S. Energy Information Administration, based on Thomson Reuters Research & Forecasts (Note: Vessel sizes range from 10,000 deadweight tons to 300,000 deadweight tons. Net change is deliveries minus demolitions.)
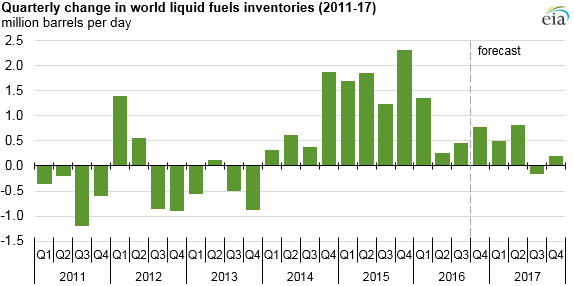
 Source: U.S. Energy Information Administration, Short-Term Energy Outlook, October 2016
 Source: U.S. EIA, based on Bloomberg and London Tanker Brokers' Panel (Note: Deadweight tons (DWT) is a measure of a vessel's capacity to carry cargo. Barrel equivalents will vary based on the cargo's density. AFRAMAX is not an official vessel classification on the AFRA scale.)

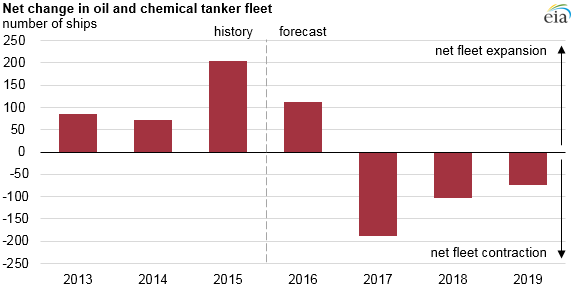

Recent expansion of the global crude oil and petroleum product tanker fleet has resulted in falling or lower tanker rates for much of 2016 that have widened the geographic scope for economically attractive trade at a time when inventories of both crude oil and petroleum products are at high levels, according to the U.S. Energy Information Administration (EIA).
In recent years, growing global oil production and growth in global refining capacity in markets distant from crude sources led to an increase in orders for new vessels in anticipation of an increasing need for tanker transportation. This resulted in several consecutive years of an expanding global tanker fleet, with an estimated net change of 205 ships added in 2015, according to Thomson Reuters.
On a global scale, demand for tankers is influenced by differences in supply and demand conditions across regional markets. Tankers of different sizes and classes have specific characteristics that help determine the markets and shipping routes they serve. For example, so-called dirty tankers, which transport unrefined or less-refined cargos (such as crude oil and residual fuel oil), tend to be large, with low per-barrel transportation costs. So-called clean tankers, which transport refined products such as gasoline and diesel fuel, are typically smaller vessels.
To date in October, monthly average rates for very large dirty tankers in the carrier (VLCC)-size range traveling between the Arabian Gulf and Singapore, an indicator for the overall dirty tanker market, are down 23 percent from January. Rates for smaller average freight rate assessment (AFRA)-size range dirty tankers on the same route are down 49 percent from January. Rates for dirty VLCC-size range tankers and AFRA-size range tankers through October have each averaged 36 percent lower, respectively, than the full year 2015 average.
Rates for clean tankers are also lower. The average October rate, to date, for a clean long range 1 (LR1)-size tanker on the Arabian Gulf-to-Japan route is down 38 percent from January. The monthly average rate for a smaller medium range (MR)-size range tanker on the same route is down 22 percent from January.
With lower tanker rates, the price spread needed for economically attractive trade between two markets narrows, making it possible for importers to bring in distant supplies at reduced cost. For exporters, lower tanker rates increase the price competiveness of their supplies in more distant markets. This can help to explain some of the motor gasoline imports to the U.S. East Coast in 2016 from relatively distant countries such as South Korea, Malaysia, Taiwan and Japan.
Low tanker rates also aid the competitiveness of U.S. crude oil exports. Currently, no U.S. port is capable of loading the larger vessels typically used to transport crude oil, so U.S. crude exporters must use more expensive smaller vessels. However, with lower tanker rates, exporters may be able to load smaller ships at U.S. ports and transfer the cargoes onto larger vessels offshore for transport to final destinations at an attractive per-barrel cost. This may explain U.S. Customs data showing some crude oil exports to places like the Marshall Islands, a nation where many vessels are registered but are most likely not taking deliveries.
Going forward, tanker rates should recover as the global market slowly returns to balance. EIA's most recent Short-Term Energy Outlook (STEO) forecasts a global quarterly draw in crude oil stocks in the third quarter of 2017, the first since 2013.