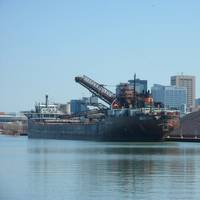
US-flag Great Lakes Shipping Up 6.5% in 2023
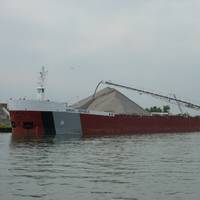
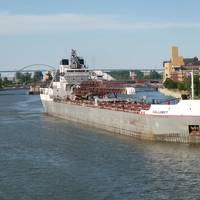
Cargo volumes moved by U.S.-flag Great Lakes freighters in 2023 increased 6.5% compared to 2022, according to latest figures from trade group the Lake Carriers’ Association (LCA).The 81.4 million tons of cargo transported by the U.S. laker fleet 2023 was 1.2% above the fleet’s five-year average, LCA said.Iron ore cargos totaled 42.4 million tons, an increase of 13.4% compared to a year earlier, while limestone shipments increased by 3.9% to 24.6 million tons. Sand shipments increased by 12.4%.Coal cargos were down 9.7% to 8.4 million tons.
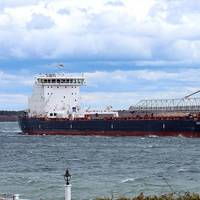
US-flag Shipping on the Great Lakes Up 16.8% in 2021
U.S.-flag Great Lakes freighters (lakers) moved 81.8 million tons of cargo in 2021, an increase of 16.8 percent compared to 2020, the Lake Carriers' Association (LCA) reported. The 2021 float was less than 1% below the fleet’s five-year average.Iron ore cargos totaled 41.7 million tons, an increase of 12.4% compared to a year earlier. Shipments of all other commodities increased as well in 2021. Coal cargos were up 42.7% to 10.4 million tons. Limestone and cement shipments increased by 16.7% and nearly 5%, respectively. Salt cargos were up by 34.2%.
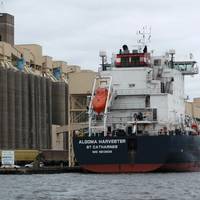
Great Lakes-Seaway Shipping Boosted in June
United States grain exports via the St. Lawrence Seaway are up 32.1 percent this season compared to 2017. Construction materials were also heavily influential in the latest results with a nearly 38 percent increase in asphalt from the same time last year, as well as increases in cement and stone.“Summer is the season for construction projects and ships have been delivering materials for major building projects across the region,” says Bruce Burrows, President of the Chamber of Marine Commerce. “U.S.
Great Lakes-Seaway Shipping Rebounds in August
Great Lakes-St. Lawrence Seaway shipping rebounded in August due to a surge in U.S. grain exports, iron ore shipment improvements and a steady flow of raw materials for manufacturing and construction. “We’ve seen a real rally in August. St. Lawrence Seaway cargo shipments were up 8 percent compared to the same month last year,” said Stephen Brooks, President of the Chamber of Marine Commerce. “U.S. grain exports now match last season’s strong performance. Iron ore shipments have improved as Canadian and U.S.
March US-flag Lakes Cargoes Double from 2015
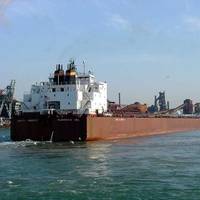
U.S.-flag Great Lakes freighters (lakers) moved 1,747,111 tons of cargo in March, more than double their total of a year ago, according to the Lake Carriers’ Association (LCA), who said the March float was also on pace with the month’s five-year average. Iron ore cargos totaled 1,362,768 tons, again more than double the volume of a year ago, while coal cargos totaled 133,155 tons, basically a repeat of a year ago. Limestone cargos dipped slightly to 68,275 tons, but shipments of cement more than tripled the volume of a year ago, rising to 182,913 tons.
US Grain Shipments via St. Lawrence Seaway Up 63%
American grain shipments through the St. Lawrence Seaway are up 63 percent so far this season as ships transport corn to Canada and soybeans for international export, reports the Chamber of Marine Commerce. According to figures from the St. Lawrence Seaway, U.S. grain totaled 765,000 metric tons for the period from April 2 through July 31. U.S. Great Lakes ports that receive and export grain through the waterway include Duluth-Superior, Toledo, Milwaukee, Chicago, Indiana Burns Harbor and Buffalo.
Saudi Cement Shortage: Ten Million Tons on Order
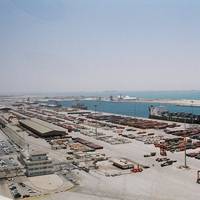
Saudi Port Authority (SPA) says cement shipments have been coming since implementation of the decrees of Custodian of the Two Holy Mosques King Abdullah to import 10 million tons of cement to cover local demand. Citing the press spokesman for the SPA, Arab News reports that seven seven ships with 202,000 tons of cement reached Dammam Port last week; one ship was loaded with 50,000 tons and another with 45,000 tons. Additionally, 72,000 tons will come through Jazan Port. The spokesman added that the incoming shipments from the UAE will help face up to the continuing cement crisis.
Year-to-Date Seaway Shipments ‘steady as she goes’

U.S. ports post positive numbers. For the period March 22 to September 30, year-to-date total cargo shipments were 25.1 million metric tons, virtually flat over the same period in 2011, as reported by the St. Lawrence Seaway. “Cargo tonnage on the Seaway System remained relatively steady for the month of September,” said Rebecca Spruill, Director, Trade Development for the Saint Lawrence Seaway Development Corporation. “These tonnage numbers reflect historical trading patterns for the month of September, with the noteworthy increase in shipments of windmill components.
August Seaway Cargo Shipments Up

August Seaway cargo shipments up nearly 7 percent. The St. Lawrence Seaway reported a 6.78 percent increase for total cargo shipments in August – 4.3 million metric tons – compared to August 2011. For the period March 22 to August 31, year-to-date total cargo shipments were 21.3 million metric tons, up 1.50 percent over the same period in 2011. “With four months remaining in the 2012 Navigation Season for the Great Lakes-St. Lawrence Seaway System, tonnage figures for the month of August remain on the positive side…
‘Super-sized’ Seaway Cargoes to U.S Ports

Economic conditions and severe weather conditions have formed the perfect storm to slow some traditional trade at U.S. ports along the St. Lawrence Seaway System. The St. Lawrence Seaway reported that year-to-date total cargo shipments for the period March 22 to July 31 was 17.1 million metric tons, virtually flat over the same period in 2011. While July is usually a slow month on the System, not all the news was negative. “The Great Lakes Seaway system is an attractive market for breakbulk cargoes, and offers one of the most promising areas for growth,” said Craig H.