Danaos 3Q, 9 Month Report
Danaos Corporation (“Danaos”) (NYSE: DAC), a leading international owner of containerships, reported unaudited results for the period ended September 30, 2008. Highlights for the Third Quarter and Nine Months Ended September 30, 2008:
• Net earnings from continuing operations of $28.0 million or $0.51 per share and $93.2 million or $1.71 per share for the quarter and the nine months ended September 30, 2008, respectively, compared to $25.5 million or $0.47 per share and $78.4 million or $1.44 per share for the respective periods of 2007.
• Operating revenues from continuing operations of $76.4 million and $220.2 million for the quarter and the nine months ended September 30, 2008, respectively, compared to $62.6 million and $187.5 million for the respective periods of 2007.
• EBITDA from continuing operations of $51.0 million and $156.9 million for the quarter and the nine months ended September 30, 2008, respectively, compared to $40.3 million and $122.8 million for the respective periods of 2007.
• Paid dividends of $0.465 per share on August 20, 2008, for the second quarter of 2008 and declared dividends of $0.465 per share for the third quarter of 2008, payable on November 19, 2008, for all shareholders on record as of November 5, 2008.
Danaos’ CEO Dr. John Coustas commented:
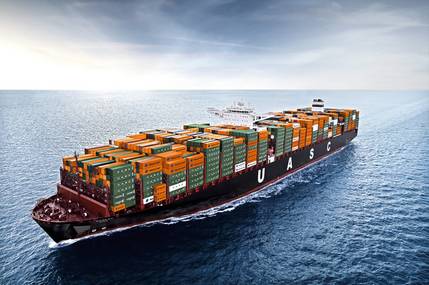
Our nine month and 3rd quarter results were excellent. Our combined fleet today stands at 70 large cellular containerships, all of which are chartered for long periods at fixed rates. Out of these 70 vessels, we expect 32 to be gradually delivered for operations until the third quarter of 2011.
During the third quarter we were able to once more successfully continue expanding our credit facilities and implementing our growth strategy by adding new vessels to our fleet. We also managed to extend our chartering arrangements while we further applied cost control strategies to boost the quality of our operations and the overall performance of our business.
Since the beginning of the year we have managed to arrange $1.1 billion in new credit facilities. Out of those $560 million were negotiated during the first quarter, while since the beginning of the third quarter we have arranged additional credit lines for an impressive $550 million. We believe that this fact alone further underscores the strength of Danaos’ credit and the faith of our lenders in our business model and our hands-on management. We will continue to arrange further credit facilities in line with our financing program and strategy.
On the operations side we added two 4,250 TEU new-building containerships in our fleet which immediately entered into 12 year charters with ZIM Lines. In September we also extended the employment of the MAERSK Deva at an increased charter rate for another two years until March 2011.
Last, but equally important, we will refer to our successful cost management. Slow steaming and a rapidly falling average age of our fleet combined with our efforts to further control costs related to crews and maintenance have led to notable results. Our daily operating cost per vessel for the first nine months in 2008 increased by just 2.8% compared to that for the same period in 2007. At the same time our daily operating cost was 2.9% lower this quarter compared to that of the second quarter.
We believe that our business model, which is based on long term fixed rate chartering to some of the largest liner companies in the world, gives protection to our top line against volatility and weakness in the charter market. Furthermore, our continued and recently demonstrated ability to raise debt during a period where credit has become very scarce, underlines both our solid strategy and the continued confidence in Danaos by our lending banks. We continue to have a strong balance sheet which together with our strong cash flow allows us to closely monitor the sale & purchase market and consider any opportunities for further growth as they may arise.
Finally, on October 24, 2008, our Board of Directors declared a dividend of $0.465 per share for the third quarter, which will be paid on November 19, 2008. The dividend reflects the continuing growth of our operations, our confidence in the stability of our business model and our dedication to support shareholder value through enhanced distributable cash flows.
Three months ended September 30, 2008 compared to the three months ended September 30, 2007:
During the quarter ended September 30, 2008, Danaos had an average of 38.1 containerships as opposed to 31.1 containerships for the same period of 2007. During the third quarter we acquired two vessels the Zim Rio Grande on July 4, 2008 and the Zim Sao Paolo on September 22, 2008. Our fleet utilization was 98.8% in the third quarter of 2008.
Given the sale of our entire dry bulk fleet in the beginning of 2007, management has determined that the dry bulk business constituted discontinued operations. The management and discussion analysis solely reflects results from continuing operations (containerships), unless otherwise noted.
Our net income was $28.0 million or $0.51 per share for the third quarter of 2008 compared to $25.5 million or $0.47 per share for the third quarter of 2007, which represents an increase of 9.8% or $2.5 million. Distributable cash flow, defined as net income before depreciation & amortization, less payments for drydocking and special survey costs was $40.5 million for the third quarter of 2008. Our declared dividend of $25.4 million for the third quarter of 2008 represents 62.7% of our distributable cash flow.
Operating Revenue
Operating revenue increased 22.0%, or $13.8 million, to $76.4 million in the quarter ended September 30, 2008 from $62.6 million in the quarter ended September 30, 2007. We also had a further increase in revenues of $0.6 million attributed to higher charter rates achieved due to the re-chartering of certain vessels.
Vessel Operating Expenses
Our daily operating expenses per vessel increased 4.3% compared on a quarter on quarter basis. The increase was mainly due a general increase in costs experienced by the overall industry. At the same time, our daily operating expenses per vessel compared to those of the second quarter of 2008 decreased by 2.9%, which was mainly attributed to the decrease of the average age of our fleet as a result of the addition of two new building vessels during the third quarter of 2008, as well as lower lubricant expenses attributed to slow steaming and lower insurance cost.
In absolute numbers, vessel operating expenses increased 47.1% or $7.3 million, to $22.8 million in the quarter ended September 30, 2008, from $15.5 million in the quarter ended September 30, 2007. The increase was mainly due to the increase in the average number of our vessels in our fleet during the quarter ended September 30, 2008 compared to the quarter ended September 30, 2007.
Depreciation & Amortization
Depreciation & Amortization includes Depreciation and Amortization of Deferred Dry-docking and Special Survey Costs.
Depreciation
Depreciation expense increased 36.8%, or $3.5 million, to $13.0 million in the quarter ended September 30, 2008, from $9.5 million in the quarter ended September 30, 2007. The increase in depreciation expense was due to the increased average number of vessels in our fleet during the quarter ended September 30, 2008 compared to the same period of 2007.
Amortization of Deferred Dry-docking and Special Survey Costs
Amortization of deferred dry-docking and special survey costs increased 18.8%, or $0.3 million to $1.9 million in the quarter ended September 30, 2008, from $1.6 million in the quarter ended September 30, 2007. The increase reflects higher drydocking costs incurred, which were subject to amortization during the three months ended September 30, 2008 as compared to the same period of 2007.
General and Administrative Expenses
General and administrative expenses increased 12.0%, or $0.3 million, to $2.8 million in the quarter ended September 30, 2008, from $2.5 million in the same quarter of 2007. The increase was primarily a result of increased fees of $0.4 million paid to our Manager in the third quarter of 2008 compared to the same period of 2007, attributed to the increase in the average number of our vessels in our fleet.
Other Operating Expenses
Other Operating Expenses include Voyage Expenses Voyage expenses decreased 10.0% or $0.2 million, to $1.8 million in the quarter ended September 30, 2008, from $2.0 million for the quarter ended September 30, 2007.
Interest Expense and Interest Income
Interest expense increased 108.3%, or $5.2 million, to $10.0 million in the quarter ended September 30, 2008, from $4.8 million in the quarter ended September 30, 2007. The change in interest expense was due to the increase in our average debt by $1,107.5 million to $1,856.3 million in the quarter ended September 30, 2008 from $748.8 million in the quarter ended September 30, 2007, partially offset by the financing of our extensive new-building program which resulted in interest capitalization of $12.6 million for the quarter ended September 30, 2008 as opposed to $6.1 million of capitalized interest for the quarter ended September 30, 2007.
Interest income increased by $0.8 million, to $1.9 million in the quarter ended September 30, 2008, from $1.1 million in the quarter ended September 30, 2007. The increase in interest income is mainly attributed to higher average cash deposits during the three months ended September 30, 2008 as opposed to the three months ended September 30, 2007, partially offset by lower interest rates.
The increase in restricted cash is attributed to $282.0 million additional cash which we raised through our revolving credit facilities during the third quarter of 2008. These funds are now designated to finance certain of our new buildings and will be gradually utilized to fund progress payments of these new buildings up to their deliveries through the second quarter of 2010.
EBITDA
EBITDA from continuing operations increased by $10.7 million, or 26.6%, to $51.0 million in the quarter ended September 30, 2008, from $40.3 million in the quarter ended September 30, 2007. A table reconciling EBITDA to net income can be found at the end of this earnings release.
Nine months ended September 30, 2008 compared to the nine months ended September 30, 2007:
During the nine months ended September 30, 2008, Danaos had an average of 37.3 containerships as opposed to 31.0 containerships for the same period of 2007. During the nine months of 2008, we acquired five vessels, the Hyundai Progress on February 11, 2008, the Hyundai Highway on March 18, 2008, the Hyundai Bridge on March 20, 2008, the Zim Rio Grande on July 4, 2008 and the Zim Sao Paolo on September 22, 2008. In addition, we sold three vessels, the APL Belgium on January 15, 2008, the Winterberg on January 25, 2008 and the Maersk Constantia on May 20, 2008.
Given the sale of our entire dry bulk fleet in the beginning of 2007, management has determined that the dry bulk business constituted discontinued operations. The management and discussion analysis solely reflects results from continuing operations (containerships), unless otherwise noted.
Our net income was $93.2 million or $1.71 per share for the nine months ended September 30, 2008 compared to $78.4 million or $1.44 per share for the nine months ended September 30, 2007, an increase in net income of 18.9% or $14.8 million. Earnings per share, excluding the gain on sale of vessels of $14.9 million, were $1.44 for the nine months ended September 30, 2008. Distributable cash flow, defined as net income before depreciation & amortization, less payments for drydocking and special survey costs, was $126.9 million for the nine months ended September 30, 2008. We paid a dividend of $25.4 million for the first and the second quarter of 2008, respectively, and we declared a dividend of $25.4 million for the third quarter of 2008, which in aggregate represent 60.0% of our distributable cash flow for the nine months ended September 30, 2008.
Operating Revenue
Operating revenue increased 17.4%, or $32.7 million, to $220.2 million in the nine months ended September 30, 2008 from $187.5 million in the nine months ended September 30, 2007.
Vessel Operating Expenses
Our daily operating expenses per vessel between the nine month periods of 2007 and 2008 increased by 2.8%. The increase was mainly due to higher crew wages partially offset by lower lubricant expenses attributed to slow steaming and lower insurance cost.
In absolute numbers vessel operating expenses increased 39.7% or $18.5 million, to $65.1 million in the nine months ended September 30, 2008, from $46.6 million in the nine months ended September 30, 2007. The increase was mainly due to the increase in the average number of our vessels in our fleet during the nine months ended September 30, 2008 compared to the nine months ended September 30, 2007.
Depreciation & Amortization
Depreciation & Amortization includes Depreciation and Amortization of Deferred Dry-docking and Special Survey Costs.
Depreciation
Depreciation expense increased 27.8%, or $8.1 million, to $37.2 million in the nine months ended September 30, 2008, from $29.1 million in the nine months ended September 30, 2007. The increase in depreciation expense was due to the increased average number of vessels in our fleet during the nine months ended September 30, 2008, compared to the same period of 2007.
Amortization of Deferred Dry-docking and Special Survey Costs
Amortization of deferred dry-docking and special survey costs increased 20.5%, or $0.9 million, to $5.3 million in the nine months ended September 30, 2008, from $4.4 million in the nine months ended September 30, 2007. The increase reflects higher dry-docking costs incurred, which were subject to amortization during the nine months ended September 30, 2008 as compared to the same period of 2007.
General and Administrative Expenses
General and administrative expenses increased 17.8%, or $1.3 million, to $8.6 million in the nine months ended September 30, 2008, from $7.3 million in the same period of 2007. The increase was mainly a result of increased fees of $1.0 million paid to our Manager in the nine months ended September 30, 2008 compared to the same period of 2007 attributed to the increase in the average number of our vessels in our fleet. Moreover, public company related and other administrative expenses were higher by $0.3 million in the nine months ended September 30, 2008 compared with the nine months ended September 30, 2007.
Gain / (loss) on sale of vessels
The gain on sale of vessels for the nine months ended September 30, 2008, reflects the sale of the APL Belgium, the Winterberg and the Maersk Constantia for $44.5 million, $11.2 million and $15.8 million, respectively, resulting in an aggregate net gain of $14.9 million.
Other Operating Expenses
Other Operating Expenses include Voyage Expenses. Voyage expenses increased 9.3% or $0.5 million, to $5.9 million in the nine months ended September 30, 2008, from $5.4 million for the nine months ended September 30, 2007. The increase was mainly a result of increased bunker costs of $0.7 million, attributed to the repositioning of two of our vessels, during the second quarter of 2008. Our vessels are not otherwise subject to fuel costs, which are paid by our charterers.
Interest Expense and Interest Income
Interest expense increased 73.1%, or $10.6 million, to $25.1 million in the nine months ended September 30, 2008, from $14.5 million in the nine months ended September 30, 2007. The change in interest expense was due to the increase in our average debt by $909.3 million to $1,603.2 million in the nine months ended September 30, 2008 from $693.9 million in the nine months ended September 30, 2007, partially offset by the financing of our extensive new-building program which resulted in capitalized interest of $35.4 million for the nine months ended September 30, 2008 as opposed to $13.1 million of capitalized interest for the nine months ended September 30, 2007.
Interest income increased 5.4%, or $0.2 million, to $3.9 million in the nine months ended September 30, 2008, from $3.7 million in the nine months ended September 30, 2007. The increase in interest income is mainly attributed to higher average restricted cash deposits, partially offset by lower interest rates, during the nine months ended September 30, 2008 as opposed to the nine months ended September 30, 2007.
The increase in restricted cash is attributed to $282.0 million additional cash which we raised through our revolving credit facilities during the third quarter of 2008. These funds are now designated to finance certain of our new buildings and will be gradually utilized to fund progress payments of these new buildings up to their deliveries through the second quarter of 2010.
EBITDA
EBITDA from continuing operations increased by $34.1 million, or 27.8%, to $156.9 million in the nine months ended September 30, 2008, from $122.8 million in the nine months ended September 30, 2007. A table reconciling EBITDA to net income can be found at the end of this earnings release.
Dividend Payment
On July 25, 2008, the Board of Directors declared a dividend of $0.465 per common share for the second quarter of 2008 for all shareholders of record as of the close of business on August 6, 2008, paid on August 20, 2008. On October 24, 2008, the Board of Directors declared a dividend of $0.465 per common share for the third quarter of 2008 for all shareholders of record as of the close of business on November 5, 2008, payable on November 19, 2008.
Recent News
Since the beginning of the 3rd quarter of 2008 the Company has entered into two credit agreements for term loan facilities in the total amount of $550 million to finance part of its new-building program. The facilities have been fully underwritten by Fortis Bank, Lloyds TSB, National Bank of Greece, Deutsche Schiffsbank, Credit Suisse and Emporiki Bank, a subsidiary of Credit Agricole.
(www.danaos.com)


