By the Numbers: Boats, Cargo & the Environment


U.S. Flag Vessels by Type and Age (Number of vessels)
The latest statistical roundup of the U.S. flag fleet (2012) shows some interesting trends. We know that the U.S. blue water, deep draft fleet continues to dwindle in size and numbers – albeit some exciting recent orders for tankers and containerships. But virtually 99 percent of our commercial fleet is now represented by inland and coastal pushboats, barges and offshore service vessels. Or, in other words, the demographic represented by the readership of MarineNews magazine. What else do we know? A look at Table 1 below tells us that over the past 20 years – since 1992, when decent records started to be kept for such things – the nation’s offshore supply and related service fleet grew by more than 50 percent. The advent of the deepwater offshore play means that the energy and maritime industries are now inextricably connected. And, with operators such as Hornbeck and Harvey Gulf (and others) embarking on aggressive domestic building programs, that trend continues today. A look at the age of our collective fleets also portends future trends. That’s because while the percent of the fleet which is younger than 6 years of age has jumped from 10 to 20 percent in just under 20 years, it is also true that the portion of the U.S. fleet that is more than 25 years old has more than doubled during the same time frame; from 18 to 40 percent. What does that mean? For starters, we are slowly building replacement tonnage in all categories, but at the same time, there is still much to be accomplished. We think that bodes well for our shipbuilding industry; especially the tier II yards that concentrate on smaller tonnage and OSV projects.
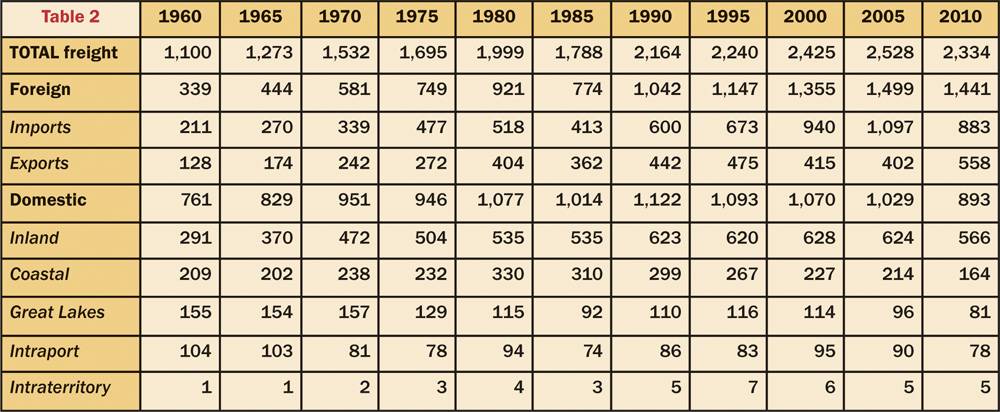
U.S. Waterborne Freight
As goes the volume and tonnage of waterborne cargo for an island nation, so goes her economy. And, the sharp drop in tonnage seen during the period between and including 2005 and 2010, depicted in Table 2 (in millions of short tons), is ample testimony to that. The severe recession experienced during that time had a profound effect on all transport sectors. Speaking more to long term trends, we can see that waterborne freight has more than doubled in the past 50 years, but during that time (no surprise here), the domestic share of that pie has shrunk from about 70 percent to just under 40 percent. But, owing to the importance of our inland sector, the inland share of total freight has remained steady at about 25 percent. In the Great Lakes – and no doubt this is (partly) a function of inadequate dredging and short loaded cargoes, the domestic share by Lakers has shrunk to just 3 percent from about 14 percent in 1960. Our intraport cargoes – now called shortsea shipping – have dipped from 10 to a dismal 3 percent. So much for America’s Marine Highways …
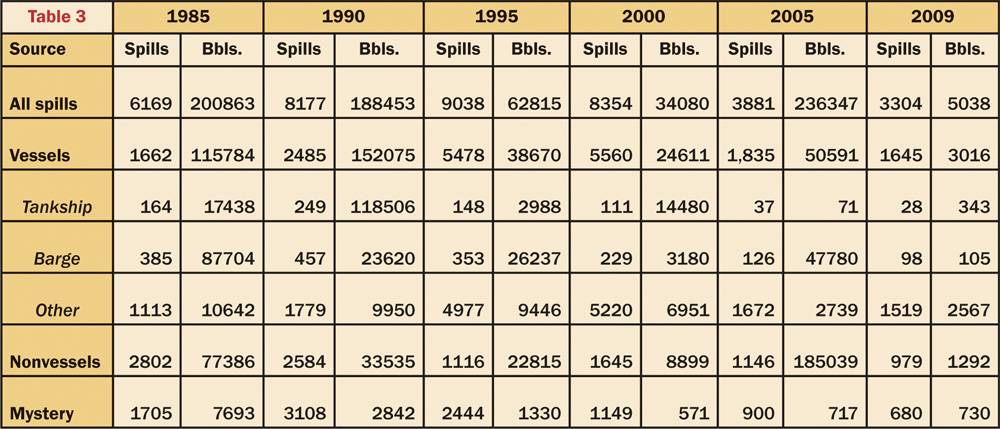
Petroleum Oil Spills Impacting Navigable U.S. Waterways
Don’t believe the hype. We are getting cleaner as an industry. In less than 15 years, the number of total spills and incidents has nearly halved, and in terms of the tankship and tank barge sectors, spills and related barrels per spill have dropped dramatically. As a percentage of barrels spilled, for example, tank vessels now account for less than 10 percent of all spills in U.S. waters, down from more than a 50 percent share just 15 years ago. In terms of total incidents, tank vessels now account for about 4 percent of total incidents, one half of what it was in 1985.
Those metrics continue to improve every day.
All statistics in this report reflect information obtained via the Research and Innovative Technology Administration of the U.S. Department of Transportation’s Bureau of Transportation Statistics. Access the maritime database on their site by visiting: http://www.rita.dot.gov/bts/data_and_statistics/index.html
(As published in the July 2013 edition of Marine News - www.marinelink.com)