Overcapacity and low demand growth set the tone in the 2010s -BIMCO

Over the past decade, the developing world economy has allowed for strong growth in shipping activities, with the demand for transport never having been higher. However, the benefits of this growth have been limited due to the industry jeopardizing the good times by ordering too many ships.
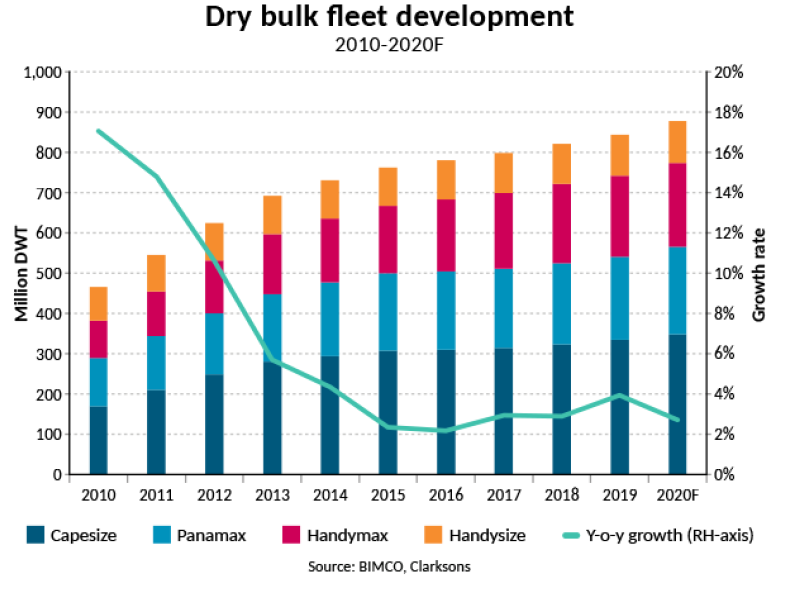
In the 2010s, the supple of ships has largely outgrown demand, putting freight rates under pressure persistently and causing challenging conditions for the dry bulk market. A total of 413 million DWT has flooded the marked since the turn of the decade, bringing the world dry bulk fleet to 878.6m DWT at the start of 2020, an 88.8% increase from the start of 2010. During the same period demand grew at less than half that rate at 40.3%.
With the coronavirus hitting economies as soon as this new decade begun and the world entering an unprecedented recession, the past decade has determined in what condition the shipping industry enters this new challenge.
“While the overcapacity that dominated the dry bulk market in much of the 2010s continues into this new decade, the coronavirus will surely leave its mark on the 2020s. This puts demand under severe pressure and causes high uncertainty as to how the situation will develop, even as ordering activity and fleet growth slows,” Peter Sand, BIMCO’s Chief Shipping Analyst says.
Fleet growth rates varied by sector
The Capesize and Handymax fleets experienced the highest growth, both more than doubling in size over the course of the decade, adding 178m DWT and 115.2 m DWT to their respective fleets (+104.6% and 123.8%). The Handysize fleet had the lowest growth during the decade, adding only 22.8m DWT to bring the fleet to 104.7m DWT (+27.8%).
Fleet growth was highest at the start of the decade, as vessels ordered at the peak of the market - before the Great Financial Crisis - were delivered. The largest growth in absolute terms came in 2011 when the fleet grew by a net of 80.9m DWT. Both 2011 and 2012 had over 100m DWT of gross deliveries, offset by demolition of 6.5m and 23.3m DWT respectively. The slowest year for net fleet growth was 2016, during which the fleet grew by 17m DWT, the lowest fleet growth in percentage since the late 90s (1998-1999).
An almost constantly deteriorating fleet utiliZation
Despite fleet growth slowing towards the end of the decade, 2014 and 2017 were the only two years that decade in which the fleet grew slower than demand, which is what is needed for the fundamental balance and therefore for the market to improve. Testament to this, both 2014 and 2017 saw higher average earnings in most dry bulk sectors.
The worsening of the balance over the course of the 2010s meant that freight rates were under pressure. In the Capesize market, where an average ship needs at least $15,000 per day to cover its financing and operating costs, average freight rates were only above this breakeven level during half of the decade.
Demand growth lagging fleet growth in all but two years
2010 was the year in the decade with the highest demand growth, with demand in million tonnes up by 12.7% and tonne mile demand rising by 13.7%. Throughout the decade, demand trended lower. The lowest growth in tonne miles was in 2019 at only 0.6%, whereas measured in tonnes, the lowest demand growth came in 2015 at only 0.2%.
Over the whole decade, demand grew by 40.3% when measured in tonne miles, from 20,971.3 billion tonne-miles to 29,416.9b, and 37.3% when measured in tonnes, from 3,837.4 million tonnes to 5,268.6m. The strongest growth came from grain volumes, which were 50% higher in 2019 than in 2010, with iron ore posting an almost equally high growth rate (47.1% in tonnes and 35.5% in tonne miles), thereby keeping its dominant position in the dry bulk market ahead of “King Coal”, which took the top spot in million tonnes in 2012.
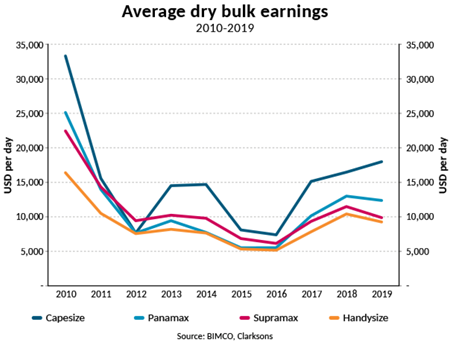
Freight rates did not return to the highs of 2010
Comparing average earnings across all sectors in dry bulk shipping shows that they peaked at the start of the decade in 2010. Furthermore, they all had their poorest year in 2016. Since then, freight rates have risen, with Capesize rates in 2019 rising to their highest level since 2010, while the smaller sectors saw rates fall from 2018 to 2019.
“The lower freight rates in the past decade compared to the 2000s are testament to the lower demand growth that has dominated since the Great Financial Crisis and the oversupply of shipping capacity. The recession that will follow in the wake of the coronavirus and its containment measures, as well as how the world will emerge from it, will set the tone for this decade,” Sand says.