Maritime Training: Implementing CI in Familiarization Training


 The Author Murray Goldberg is CEO of Marine Learning Systems (www.MarineLS.com). An eLearning researcher and developer, his software has been used by 14 million people worldwide.


Continuous Improvement (CI) is the process of continually analyzing the performance of some aspect of operations, and then applying changes intended to improve that performance. It is a critical component in maintaining the health of any operation and can be applied to almost any activity. This is the third and final installment in a series of articles intended to introduce CI, and to give some practical tips for using CI in any maritime organization to improve training effectiveness and efficiency. Implementing a modest CI process for in-house training is neither expensive nor difficult, and even a small program can produce a tremendous ROI in safety, efficiency, trainer engagement and trainee satisfaction.
The first and second articles in this series, published in the January (http://digitalmagazines.marinelink.com/nwm/MaritimeReporter/201601) and February (http://digitalmagazines.marinelink.com/nwm/MaritimeReporter/201602) editions of Maritime Reporter and Engineering News respectively, introduced continuous improvement and some key performance indicators (KPIs) applicable in maritime training. To get the most out of this article, it would be useful to review those posts before progressing with this one.
In this article, I complete this series by talking about specific key performance indicators which are likely to be available if (or once) a learning management system (LMS) is employed in the delivery and management of job and familiarization training. These KPIs provide deep insight into learning activities and performance, and can be used as part of the foundation upon which continuous improvement is implemented.
Key Performance Indicators
The focus of the second and this third article is Key Performance Indicators. Key Performance Indicators (KPIs) are the foundation of any CI process. KPIs are measurements used to evaluate effectiveness and efficiency. This is critical - unless we have a way of measuring whether changes made in the name of CI have created an improvement in outcomes (effectiveness and efficiency), there is no way of telling whether we are moving closer to, or further away from, our goal. KPIs provide that information by measuring the success of every change made.
As a reminder, KPIs should minimally satisfy the following requirements:
● They must be aligned with corporate goals.
● They should react reasonably quickly to changes made in training.
● They must track something the organization has some control over. Otherwise, although they may be interesting to track, they are not helpful in the process of tuning training outcomes.
LMS-Enabled KPIs
Overview
As with many data-driven systems (and KPIs are just that - data), technology is our friend here. Computer-based learning management systems (or LMSs) generate a wealth of KPIs that track learning and assessment effectiveness. These are metrics which cannot otherwise be practically obtained. In fact, metrics are one of the greatest strengths and benefits of using an LMS and that is one of the reasons that most large training organizations use an LMS. Because the use of LMSs is now rapidly expanding in the maritime industry, it is time to begin thinking about how an LMS can improve the process of continuous improvement in operational training.
In order to understand how an LMS can generate the KPIs we are interested in here, it is important to have a basic understanding of what an LMS is. Here is a short, edited definition from Wikipedia:
A learning management system (LMS) is a software application for the delivery, management, tracking, and reporting of training and assessments. A robust LMS should be able to do the following:
● Assemble and deliver standardized training content rapidly
● Consolidate training initiatives on a scalable web-based platform
● Personalize content and enable knowledge reuse
● Centralize and automate training administration
Note the emphasis in the definition on “management, tracking and reporting”. It is the “reporting” aspects we are most concerned about here.
The KPIs
Let’s take a look at some examples of “LMS-enabled KPIs” and discuss how they can be used in a process of continuous improvement.
Individual Exam Question Metrics
LMSs can be used to deliver exams, and while doing so, are able to record various kinds of metrics. The exam metrics often found to be the most compelling are per-question statistics.
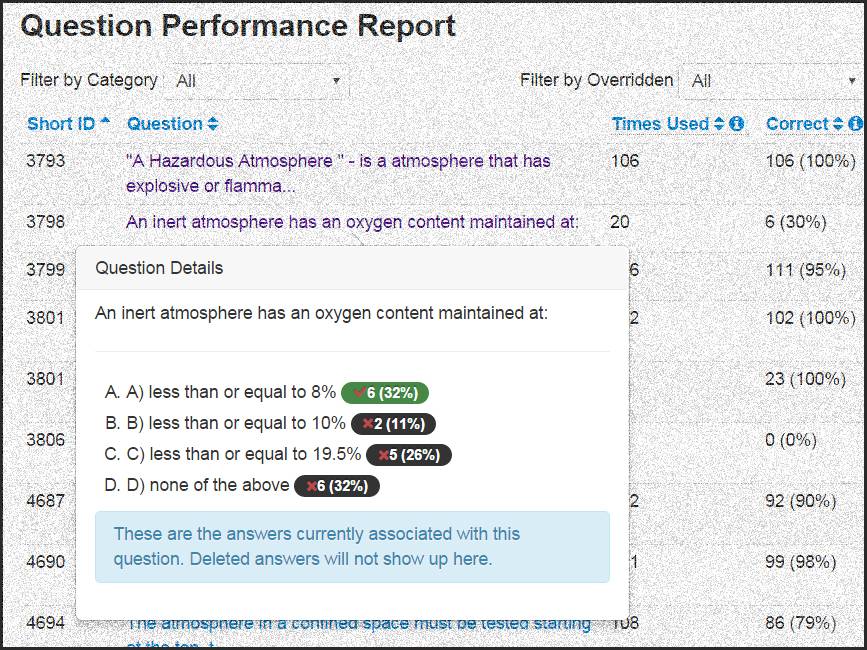
One form of per-question statistics is a report on the distribution of answer choices for each question in the system. This is outstanding information to have because it highlights hidden weaknesses in training which are unlikely to otherwise be apparent. For example, it may be the case that in general, trainees are passing exams with flying colors. However, despite their overall performance, they may routinely be incorrectly answering a small set of safety critical questions. If not for the metrics generated by an LMS, this would be a very difficult fault to uncover on an organization-wide basis, yet may represent a real risk to safety or operational efficiency. An LMS will alert the organization to these issues.
Another per-question metric is a report on the distribution of answers for each exam question possibly highlighting an incorrect, though commonly chosen response. This metric can help an organization identify common misunderstandings and be very helpful in updating the learning materials to correct the issue.
In either case, this metric is very useful at bringing to the surface any hidden training issues, facilitating their correction before they result in a loss.
Learning Content Access Metrics
One of the most informative and useful LMS metrics is a learning page access log. This metric shows every learning page in the system and indicates, on average, how long learners are spending on that page (referred to as “dwell” time). Trends in dwell time can be tracked to determine whether training time expectations are valid, and to alert organizations to changes which could be caused by candidate differences or changes in the training materials.
More importantly, dwell time can be used to identify pages which are outliers. For example, our experience has shown that dwell times for most learning pages fall into a range of about 30 seconds to one minute, but there are a small number of pages with very short dwell times, and another small group with very long dwell times. In either case, the LMS has exposed these outliers, alerting the organization to the potential training issue. A quick visit to that page will usually make it immediately apparent whether there is a problem, and if so, how it can be resolved. These metrics provide a window of insight into how trainees use the learning materials; an insight which would not otherwise be available. This is a great example of how technology can be our friend when analyzing training activities for the purpose of continuous improvement.
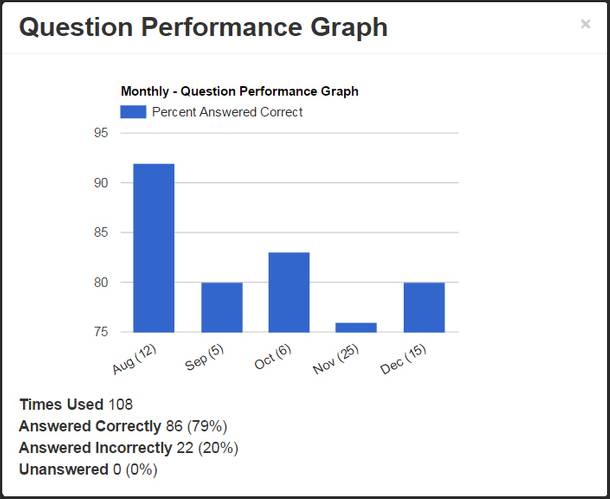
Overall Exam Performance Metrics
Another metric that is easily generated by most LMSs is that of overall exam performance. This is a metric which can be maintained without an LMS, but an LMS does the work automatically and usually presents tidy and flexible reporting options. Typically, for each exam in the system, an LMS will report on the average score that trainees have been achieving on that exam. This simple metric allows an organization to “keep their fingers on the pulse” of assessment performance. It is a useful audit metric that can be tracked over time to watch for increases or decreases. Such variations must be examined carefully since they could be due to a number of factors including changes in the level of knowledge of incoming candidates, changes in the exams themselves, changes in trainer preparation and performance, changes in training curriculum, and so on. All of these are important and may require attention. Regardless of the cause, they provide insight which should be tracked. Numbers which are (or are trending to be) too high or too low in relation to organizational goals indicate a problem with training or assessment and must be dealt with.
Self-test Metrics
Most learning management systems include self-evaluation (or self-tests) as one of their features. Self-tests are typically automatically graded, but no grade is recorded and the trainee is not evaluated on the basis of any self-tests they take. Instead, they are used as a formative tool by the trainee to determine whether they possess the knowledge required to progress to the next learning module or exam.
Because self-tests are used for a different purpose than summative assessments (“final” exams which test competency), metrics about self-tests tell us something very different than the metrics discussed above. Summative assessment metrics tell us whether the trainee eventually learned the material. Self-test metrics, on the other hand, tell us how quickly the trainees learned the material.
The reason for this is due to the typical usage patterns of self-tests. Trainees typically first review the learning materials, and then when they believe they know it reasonably well, they move on to the self test to validate their belief. If all goes well, they move on to the next module (or the summative test if they are finished). If, instead, the self-test yields a low score, they return to the learning materials and then, later, re-attempt the self test. This latter pattern will create a lower average score on the self-tests.
A learning management system will provide far deeper insight into the efficiency and effectiveness of training programs than we could ever hope for without the use of an LMS. In some cases, these metrics can highlight significant shortcomings in training which can lead to safety or operational problems. This is one of the benefits of an LMS which has made their use very common outside the maritime industry, and which is now greatly accelerating their use within the maritime industry.
The Author
Murray Goldberg is CEO of Marine Learning Systems (www.MarineLS.com). An eLearning researcher and developer, his software has been used by 14 million people worldwide.
As published in the March 2016 edition of Maritime Reporter & Engineering News. http://digitalmagazines.marinelink.com/nwm/MaritimeReporter/201603/