Towing Industry Safety: AWO & USCG Joint Analysis … By the Numbers


 Source: USCG
 Source: USCG

For 16 years, the National Quality Steering Committee has used three measures to track overall trends in safety and environmental protection. While not all-encompassing, the measures are considered to be useful indicators of towing industry trends. The measures are:
- Crew fatalities per 100,000 towing industry workers.
- Gallons of oil spilled from tank barges per million gallons transported.
- The number of vessel casualties (overall or by incident severity).
This report contains towing industry data and measures for calendar years 1994 to 2015. This report also includes summary statistics on crew member injuries, which the National Quality Steering Committee began tracking in 2006, for calendar years 2006 to 2015. Without a doubt, the Coast Guard and the American Waterways Operators (AWO) do a fine job interpreting the data.
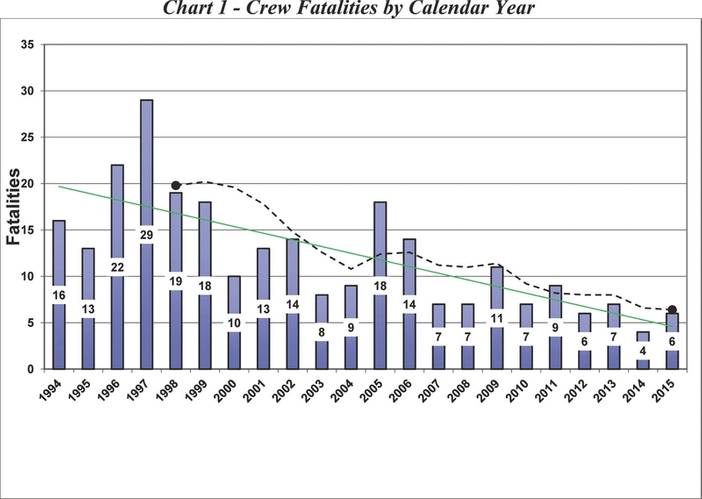
Crew Fatalities: In 2015, there were six crew fatalities. There were a total of ten towing vessel deaths reported to the Coast Guard, but only six were directly related to towing vessel operations. The other four deaths were attributed to existing medical conditions (2) and natural causes (2). Of the six crew fatalities, three were the result of crew members falling into the water. The largest number of crew fatalities is attributed to falls overboard (75 of 150, 50%). The next largest group of fatalities is attributed to asphyxiation (23 of 150, 15%).
Oil Spill Volumes: According to Coast Guard records, 147,070 gallons of oil was spilled as a result of 68 tank barge pollution incidents in 2015. Chart 5 shows the total gallon quantity of oil spilled from tank barges for calendar years 1994 to 2015. The largest spill of 120,000 gallons was the result of a collision involving the uninspected towing vessel (UTV) PB SHAH, UTV DEWEY R and their accompanying barges, which took place on the Lower Mississippi River. The collision resulted in the release of nearly all the slurry oil from one tank on the barge APEX 3508. This spill accounted for 82% of the total volume spilled in 2015. The second largest spill of 22,000 gallons was the result of the UTV PECOS, which was pushing two LNG barges, alliding with a moored tank barge. The allision resulted in the release of naphtha into the Houston Ship Channel. This spill counted for 15% of the total volume spilled in 2015. These two spills accounted for 97% of the total volume of oil spilled from tank barges in 2015.
Oil Spill Rate: The oil spill rate for 2015 is projected to be approximately one gallon of oil spilled per 521,000 gallons transported, or 1.92 gallons of oil spilled per million gallons transported. Chart 6 shows the oil spill rate from 1994 to 2015. The tank barge oil spill rate is calculated using Coast Guard spill data, along with data from the annual U.S. Army Corps of Engineers (ACOE) publication “Waterborne Commerce of the United States,” Part 5, Table 2-3. The latest version of the publication is for calendar year 2014. As such, the 2015 spill rate is a projection based on 2014 data. For 2014, the ACOE reported 76.4 billion gallons of oil transported by barge, representing 82.4% of all oil carried on domestic waterways. In 2014, the amount of oil transported by barge increased by 5.8 million short tons or 1.6 billion gallons. This represents a 2.1% increase over 2013.
Severity of Vessel Incidents: Towing vessel incidents include all reportable marine casualties that involve a towing vessel or barge. Each incident is counted only once, regardless of the number of vessels involved or events recorded. In 2015, 84% of towing vessel casualties were classified as low severity incidents. Medium and high severity incidents represented 6% and 10% of all incidents, respectively.
From 2014 to 2015, there was a significant decrease (34%) in all incidents recorded. A decrease in number of incidents was also observed in other industry segments (i.e. passenger vessels), and the Coast Guard will continue to analyze the data to determine causes for this phenomenon. While the total number of towing vessel incidents decreased by 34% from 2014 to 2015, the total number of medium and high severity incidents only decreased by 6.5%. A change in Coast Guard reporting requirements – NVIC 15-01 – is thought to have impacted the numbers. Notably, 31% of medium & high severity incidents began with an allision. Material failure was the first event in 20% of marine casualties.
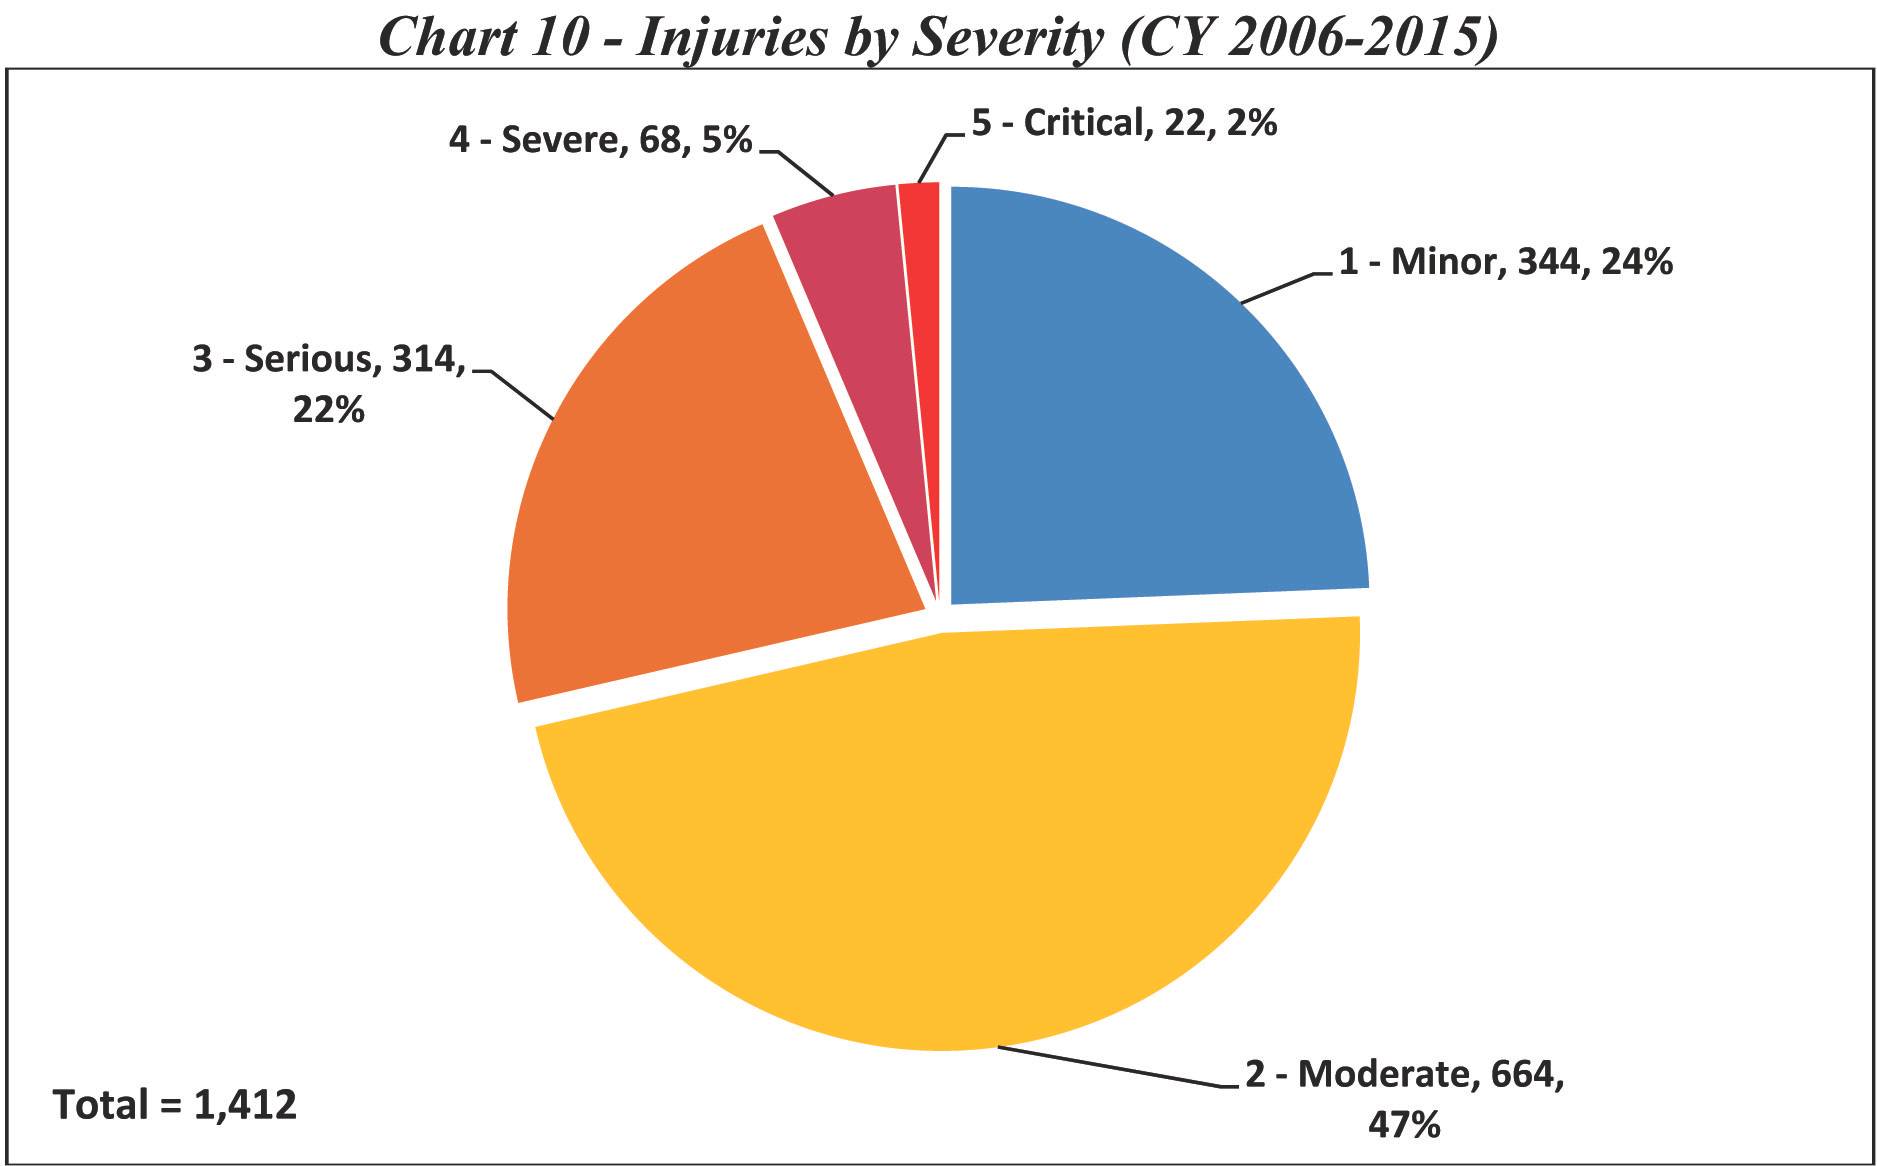
Crew Member Injuries: In 2005, the Coast Guard began documenting injury severity with each incident investigation. In 2015 there were 109 injuries to crew members where the “vessel class” or “vessel service” was recorded as “towing vessel” or “barge.” In 2015, there were only three incidents where more than one crew member was injured (one allision, two collisions). The most crew members injured in a single accident was four. In the god news department, there was a significant (34%) decrease in serious, severe and critical injuries between 2014 and 2015. From 2006 to 2015, 71% of injuries were minor or moderate in severity. 2015 data – where 73% of crew member injuries were minor or moderate in nature – compares well to the long term trend. Chart 10 shows injury data by severity and accident type. The accident types most commonly associated with higher severity injuries include falling onto a surface, line handling and/or getting caught in lines, being struck by a moving object, and/or being crushed between objects.
The full report can be found here.
The full report can be found here.
(As published in the October 2016 edition of Marine News)