Panama Canal Sees Record Grain, Salt Cargoes
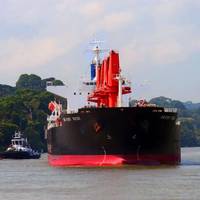
From October 2014 through March 2015, cargo shipments in dry bulkers through the Panama Canal increased by 8 percent, equaling 66 million long tons in total. During this time, the Panama Canal registered more than 2,008 transits of dry bulkers, which is 257 more transits compared to the previous fiscal year. The surge in cargo traffic was driven mainly by grains, salt, minerals, metals and manufactures of iron and steel. Furthermore, dry bulkers moved nearly 50 percent of total canal cargo and are the second leading vessel type transiting the waterway.
Panama Canal FY 2010 Q1 Metrics
The Panama Canal Authority (ACP) released first quarter (Q1) operational metrics for fiscal year 2010. In Q1, Canal Waters Time (CWT), the average time it takes a vessel to transit the Canal (including waiting time for passage) significantly decreased. There also were increases in total transits and net tonnage. These metrics are based on operations from October through December 2009, the first quarter of the ACP's 2010 fiscal year, and are compared with Q1 of fiscal year 2009. CWT decreased 27.5 percent – to 20.29 hours from 27.97 hours. CWT for booked vessels, those ships holding reservations, also experienced a decrease of 20.7 percent – to 13.43 hours from 16.94 hours. Total Canal transits increased two percent – to 3,590 transits from 3,520.
Panama Canal Authority FY 2009 Metrics
The Panama Canal Authority (ACP) announced its operational metrics for the 2009 fiscal year (FY 2009). Most importantly, Canal Waters Time (CWT), the average time it takes a vessel to navigate the Canal, including waiting time, significantly decreased. Fiscal year 2009 (October 2008 – September 2009) statistics show a slight decline in total transits and tonnage compared to FY 2008. In addition, the Canal experienced growth in some principal segments, most notably, general cargo, dry bulk, and tanker transits. In FY 2009, CWT decreased 26.9 percent – from 31.55 to 23.06 hours. For booked vessels (those ships holding reservations), CWT declined 16.1 percent – from 18.52 in FY 2008 to 15.54 hours this year.
Panama Canal Authority FY2009 Q3
The Panama Canal Authority (ACP) released third quarter (Q3) operational metrics for fiscal year 2009. In Q3, Canal Waters Time (CWT), the average time it takes a vessel to transit the Canal, including waiting time for passage, decreased significantly. Additionally, total transits and net tonnage decreased slightly. These metrics are based on operations from April through June 2009, the third quarter of the ACP's 2009 fiscal year, and are compared with Q3 of fiscal year 2008. Average CWT decreased 47.9 percent – to 19.96 hours from 38.31 hours. CWT for booked vessels (those ships holding reservations) decreased 26.5 percent – to 14.53 hours from 19.77 hours. In Transit Time (ITT) also decreased 26.6 percent – to 9.55 hours from 13.02 hours.
Panama Canal Authority 2009 Q2 Metrics
The Panama Canal Authority (ACP) released second quarter (Q2) operational metrics for fiscal year 2009. In Q2, Canal Waters Time (CWT), the average time it takes a vessel to transit the Canal, including waiting time for passage, decreased significantly, while total transits and net tonnage remained nearly flat. These metrics are based on operations from January through March 2009, the second quarter of the ACP's 2009 fiscal year, and are compared with Q2 of fiscal year 2008. Average CWT decreased 27.9 percent – to 26.22 hours from 36.39 hours. CWT for booked vessels (those ships holding reservations) decreased 19.5 percent – to 15.83 hours from 19.66 hours. The drop in CWT can be attributed to the ACP’s efficient operations and a slight decline in transits.
Panama Canal 4Q Metrics
The Panama Canal Authority (ACP) released fourth quarter (Q4) operational metrics for fiscal year (FY) 2008. These metrics are based on operations from July through September 2008, the fourth quarter of the ACP's 2008 fiscal year and are compared with Q4 of FY 2007. In Q4 of FY 2008, tonnage decreased minimally, but tanker and passenger transits and tonnage jumped significantly. During Q4 of FY 2008, Canal Waters Time (CWT), the average time it takes a vessel to transit the Canal (including waiting time for passage), decreased nearly 10 percent to 26.73 hours from 29.61 hours in Q4 of FY 2007.
Panama Canal Releases 2Q Data
Total Canal transits decreased 2 percent during Q2 – from 4,053 to 3,971 transits. Panama Canal/Universal Measurement System (PC/UMS) tonnage also dropped 2.6 percent – from 80.4 million PC/UMS tons to 78.4 million PC/UMS tons. Passenger transits increased 34.8 percent – from 92 to 124 transits – while dry bulk transits rose 6.7 percent, from 586 to 625 transits and dry bulk cargo tonnage increased 10.4 percent, from 12.3 to 13.5 million PC/UMS tons. The number of containers, vehicle carriers, tankers and general cargo dropped when compared to figures for FY 2007. Refrigerated cargo transits slightly decreased, by 1.4 percent, but refrigerated cargo tonnage increased 1.1 percent – from 5.6 million PC/UMS tons to 5.7 million PC/UMS tons.
Panama Canal Sets Record in Tons of Cargo
March 16 was a great day for the Panama Canal Authority (ACP) as a new significant record was set. More than one million (1,005,551) Panama Canal/Universal Measurement System (PC/UMS) tons of cargo were transported through the Canal. This new record breaks the recent July 3, 2003 figure of a recorded 934,488 PC/UMS tons of cargo. Contributing to the tonnage were the Canal traffic of seven container vessels, 11 dry bulk carriers, four vehicle carriers and three cruise ships. Of the seven container vessels, five were 900 feet long. And, of the cruise ships, one ship was 900 feet long and another measured 800 feet. In addition, total Canal revenue, generated from tolls, exceeded three and one half million dollars - totaling $3,563,490.55.
Panama Canal Sets Cargo Record
On March 16 the Panama Canal Authority (ACP) set a new significant record. were transported through the Canal. recorded 934,488 PC/UMS tons of cargo. four vehicle carriers and three cruise ships. long. And, of the cruise ships, one ship was 900 feet long and another measured 800 feet. totaling $3,563,490.55. "We are very pleased with the new record we have set," said ACP Administrator Alberto Alemán Zubieta. goods to market from Asia to the U.S. East Coast and vice-versa," Alemán added. increased capacity. tugboats and the deepening of Gatun Lake.
Panama Canal Authority Proposes New Pricing Structure
The Panama Canal Authority released a formal proposal to change its pricing structure to move toward a market-oriented business model that allows for greater customer service and continual improvements to the Canal. As global trade continues to expand, the shipping industry has evolved significantly and the Canal's 90-year-old pricing structure needs to be changed to meet the increasing demands of a dynamic market place. "This historic shift in our business model is the first step toward changing the long-standing, one-size-fits-all pricing structure and replace it with a system that is more tailored to individual customer needs," said Alberto Aleman Zubieta, the Canal Administrator.
Panama Canal Authority Releases Q3 Metrics
The Panama Canal Authority (ACP) released third quarter (Q3) operational metrics for fiscal year 2007. Canal Waters Time (CWT), the average time it takes a vessel to transit the Canal including waiting time for passage, decreased. In Q3, there was also a minor decrease in net tonnage, total transits and booking slot utilization. These metrics are based on operations from April through June of 2007, the third quarter of the ACP's 2007 fiscal year, and compared to Q3 of fiscal year 2006. Panama Canal/Universal Measurement System (PC/UMS) tonnage decreased 0.3 percent - to 75.6m PC/UMS tons from 75.9 million PC/UMS tons. Total Canal transits also decreased 0.3 percent - to 3,727 transits from 3,737.
ACP Releases Second Quarter Metrics
The Panama Canal Authority (ACP) released second quarter (Q2) operational metrics today for fiscal year 2007. In Q2, there was an increase in net tonnage, total transits and booking slot utilization. There was also an increase in official accidents. Canal Waters Time (CWT), the average time it takes a vessel to transit the Canal including waiting time for passage, decreased. Q2 of fiscal year 2006. Panama Canal/Universal Measurement System (PC/UMS) tonnage increased 6.30 percent - to 79.7 million PC/UMS tons from 75 million PC/UMS tons. The steady climb in tonnage was complemented by an increase in traffic, including transits of Panamax vessels (the largest vessel that can transit the Canal). 4,052 transits from 3,869.
Panama Canal Authority Releases Q1 Operational Metrics
The Panama Canal Authority (ACP) released first quarter (Q1) operational metrics today for fiscal year 2007. In Q1, there was an increase in net tonnage, total transits and transits of supers (vessels 91 feet or more in beam). No official accidents occurred this quarter. transit the Canal including waiting time for passage, increased, as well as booking slot utilization. first quarter of the ACP's 2007 fiscal year, and compared to Q1 of fiscal year 2006. Panama Canal/Universal Measurement System (PC/UMS) tonnage increased 11.7 percent – to 79.9 million PC/UMS tons from 71.5 million PC/UMS tons. the Canal experienced an increase in traffic. Total Canal transits increased eight percent – to 3,568 transits from 3,299.