New Wave Data Underpins Ship Structural Integrity


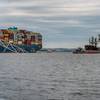
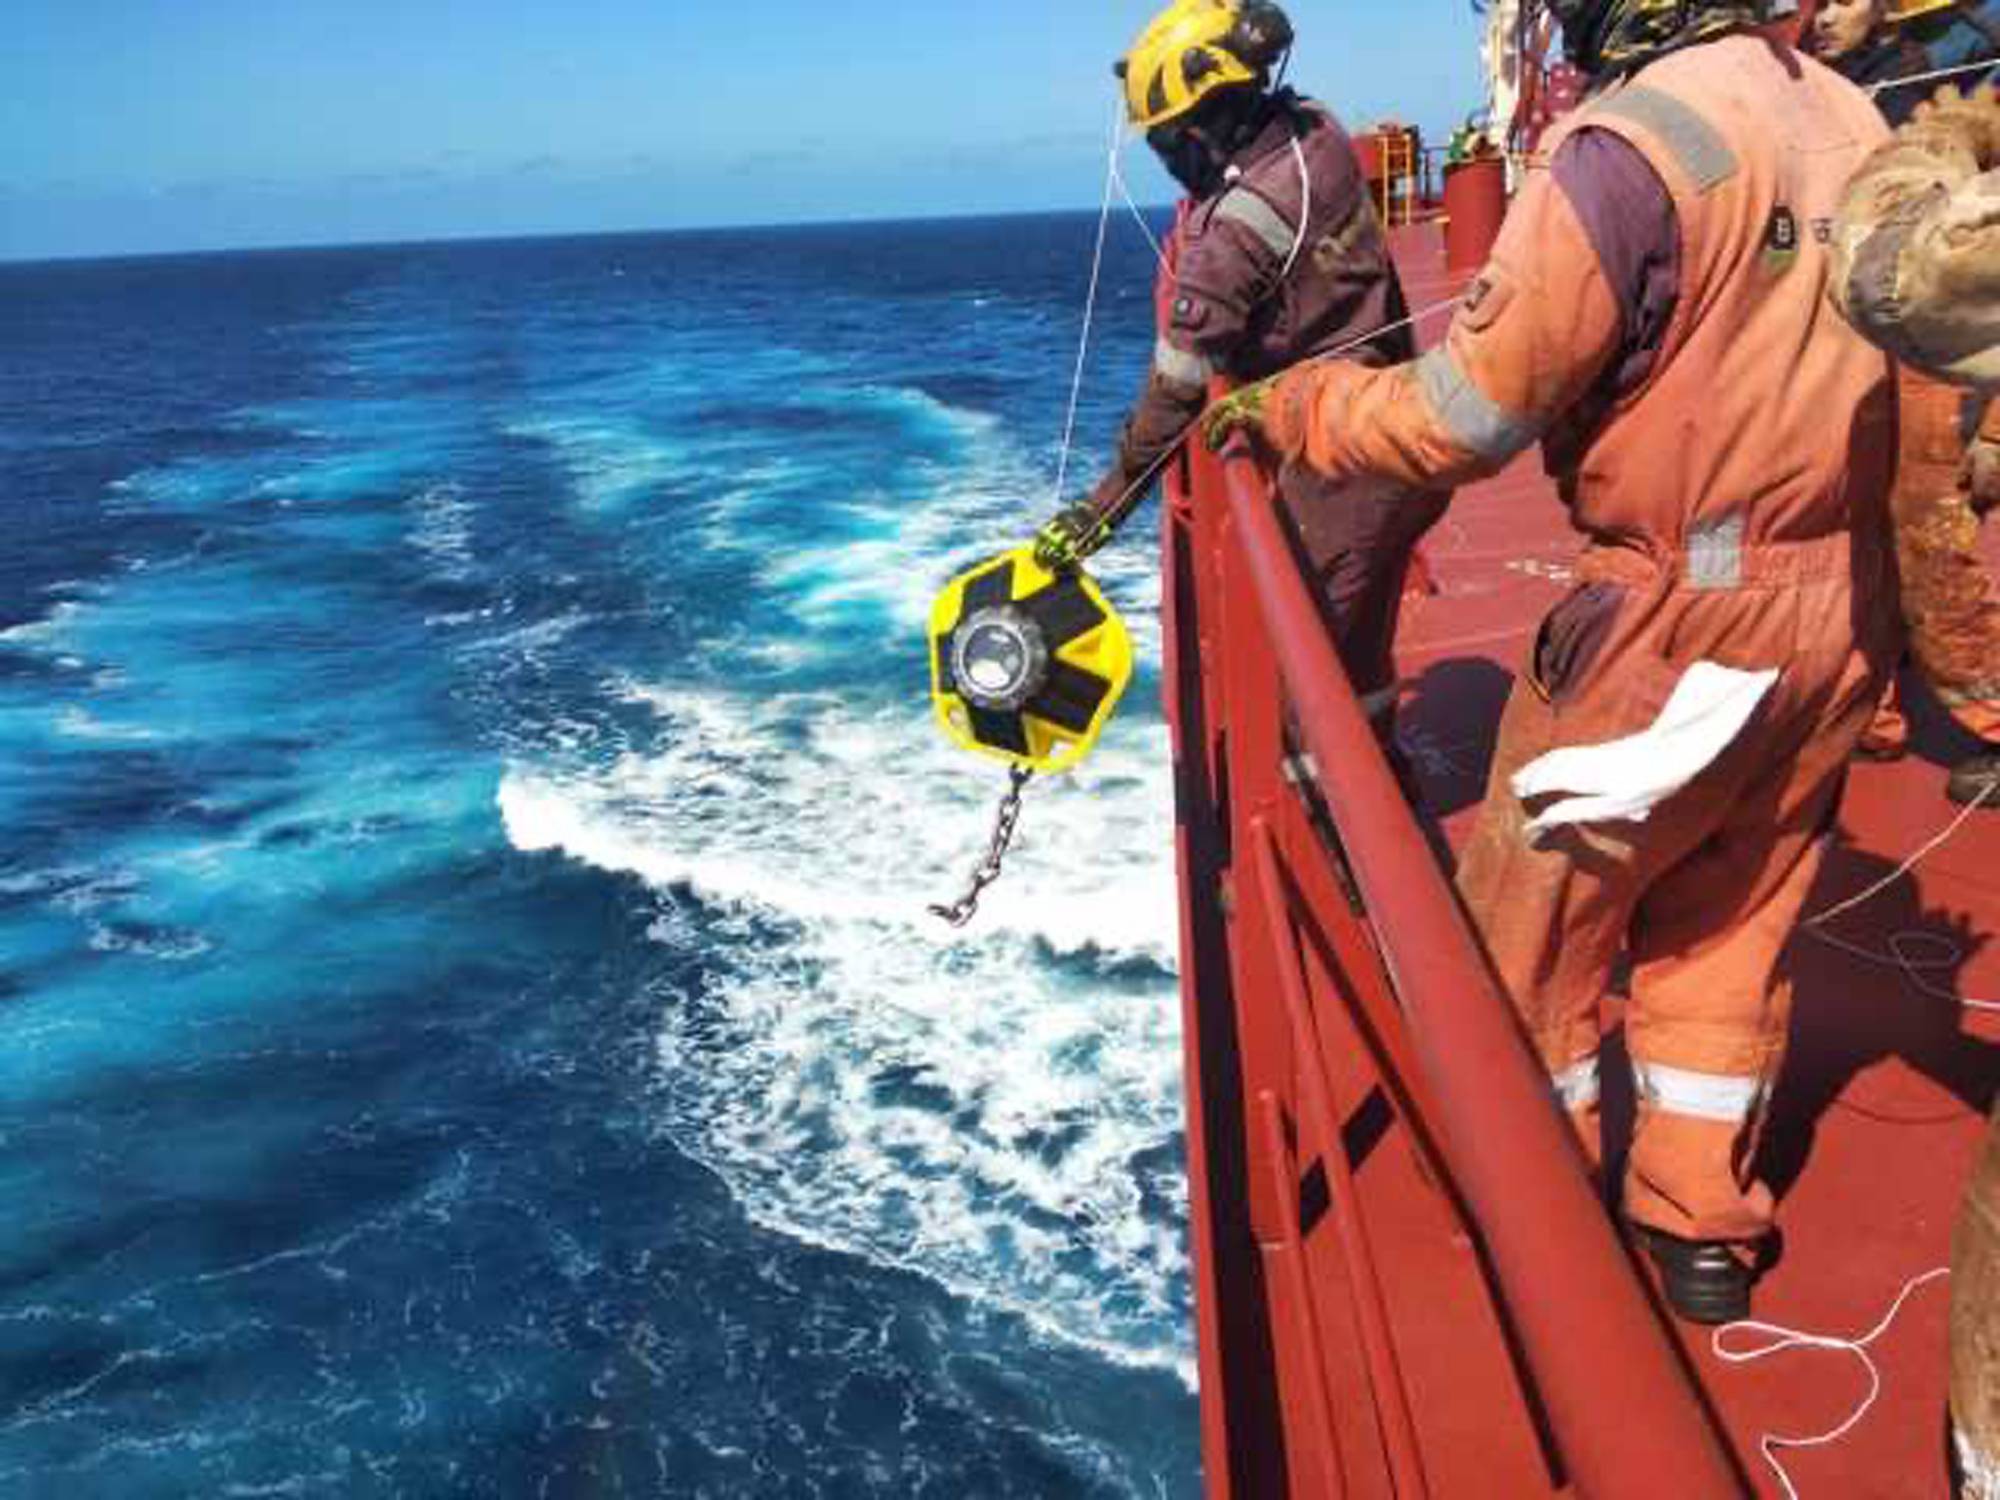
 Sofar Ocean’s hundreds of Spotter buoys continuously contribute masses of accurate wave data. Image courtesy of Sofar Ocean
 Dr. Tim Janssen, Co-Founder and CEO, Sofar Ocean
 Petter Andersen, SVP, Shipping Digital, StormGeo


The loss of the Stellar Daisy in 2017 was a tragic reminder of the importance of wave data to ship design and operation. The vessel sank in the South Atlantic Ocean, with 22 of 24 crewmembers lost. The structural failure of the vessel was attributed to several factors including material fatigue and the forces imposed on the hull as a result of the weather conditions.
Survey requirements for some vessel types have since been tightened, but even before this tragedy, work was underway to evaluate the wave data used to determine ship structural integrity requirements. In 2016, the International Association of Classification Societies (IACS) began a re-evaluation of the scatter diagram and wave spectra that define the environmental conditions used for its wave load, fatigue, and seakeeping calculations.
The resulting Version 2 of IACS Recommendation No. 34 is based on several sources of wave data, including altimetry (measurements from satellite), hindcast models (re-analysis of past weather), and wave buoys. These new, more modern, data sources represent a significant improvement in the quality of data, given that previous wave data was collected in the second half of the 20th century from visual observations onboard ships. The most recent data dated back to 1984.
It's difficult to characterize how wave height has changed over that time. While maximum significant wave height (18.5m) in Version 2 is larger than before (16.5m), the mean significant wave height is less.
Like IACS, wave and weather analysis companies rely on a wide range of data sources. “Every day, we ingest about 2.25 million discrete data points,” says Dr. Rafael Soutelino of MetOcean Solutions. This data comes from modelled data from global weather and marine models as well as satellite, lightning, weather station, wave buoy, current meter, and tide gauge data. Some data is displayed directly on the company’s MetOceanView interface, and some is shown to provide comparisons with the system’s modelled data, for example wave buoy data is displayed on a graph comparing observed to forecasted wave height.
That comparison was pertinent on February 14, 2023, the day that Tropical Cyclone Gabrielle hit New Zealand. Port of Napier’s Wave Rider Buoy measured significant wave heights of up to 6m before waves broke it free from its mooring. The forecast was 5.4m. MetOcean’s subsequent analysis suggested that a sea state with wave heights of 6m would occur on average only once every 3,000 years at the location.
Dr Tim Janssen, Co-Founder and CEO of ocean buoy and data specialist Sofar Ocean, says that if we liken the amount of data generated each year to the distance between the Earth and the sun, the amount of data we generate about the ocean would only get us 100m from the Earth’s surface. While Sofar Ocean’s hundreds of Spotter buoys already continuously contribute masses of accurate data, he sees the current global data gap ready to be drastically reduced through Bristlemouth, the first open ocean connectivity standard.
A collaboration between Sofar and strategic partners in the public and private sector, Bristlemouth delivers plug-and-play hardware interfaces to simplify connectivity between devices and is expected to accelerate the development of scalable ocean sensing systems and applications.Boosting the scope of wave monitoring could, for example, much more accurately detect and predict the impact of climate change. Based on what we know now, can we say that wave conditions are already affected? “If you get better at sensing, you can actually inadvertently create biases. If your sensor is more accurate now, you could have the perception that measurements are increasing when in reality you don’t know what impact the change in device has had. The same thing goes if you observe in more places. That might tilt your average wave height up or down,” Janssen says.
Many forecasters use the same mathematical models – it is the data fed in to those models that determines how accurate the results will be. “Is the climate changing? Absolutely,” says Janssen. “Is it going to change our weather systems over the ocean? 100%. Do we know exactly what that is looking like? No, I don’t believe we do yet. This speaks to our urgent need to rapidly expand ocean data collection at scale.”
IACS researchers have determined that while Version 2 does not include any climate forecasts, IPCC projections of changes in extreme wave height are unlikely to affect the scatter diagram.
Day-to-day forecasts are, however, particularly vulnerable to the “butterfly effect.” Previous work by ClassNK indicates that as atmospheric circulation has the nature of chaos, if there is an error in an initial value, the error in the predicted value will increase exponentially over time. Wave forecasts, therefore, are often limited to about 10 days.
Digital solution providers, including Sofar, are giving captains more sophisticated voyage planning tools so they can adapt their voyage plans to avoid adverse weather and therefore protect crew, vessel and cargo.
And that’s the purpose of StormGeo’s s-Planner Seakeeping module. Wave data is an essential component for planning a safe and efficient voyage, says Petter Andersen, Senior Vice President Shipping Digital at StormGeo. “By applying accurate weather forecasts predicting the wave height and direction days ahead, and combining this with vessel-specific response models, the captain gets alerts if the estimated vessel movement along the planned route exceeds acceptable limits.”
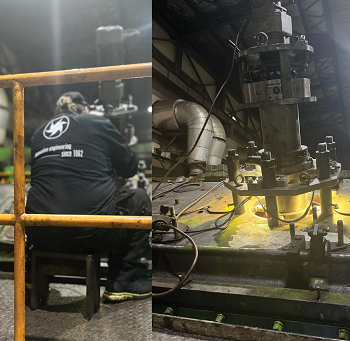
Hull stresses can be measured directly from installed sensors, and this enables navigators to receive early warning when there is a significant probability of exceeding stress and fatigue limits set by class societies – for example with Light Structures’ SENSFIBTM technology. “The application of structural health monitoring data is starting to become more diverse,” says Terje Sannerud, Chief Commercial Officer at Light Structures. “It can be utilized in condition-based inspection routines to identify the development of cracks in a structure as well as in risk-based inspection programs where the established Fatigue Design Factor can be measured against the accumulation of actual fatigue. Both examples have the potential to reduce the cost of maintenance over a vessel’s entire designed lifecycle, while of course ensuring better safety, especially during extreme weather incidents.”
He says that the investigation report into the loss of the Stellar Daisy does not mention if any form of hull monitoring solution was installed, but if it had been, the effects of stress and fatigue could potentially have been addressed prior to the tragedy.
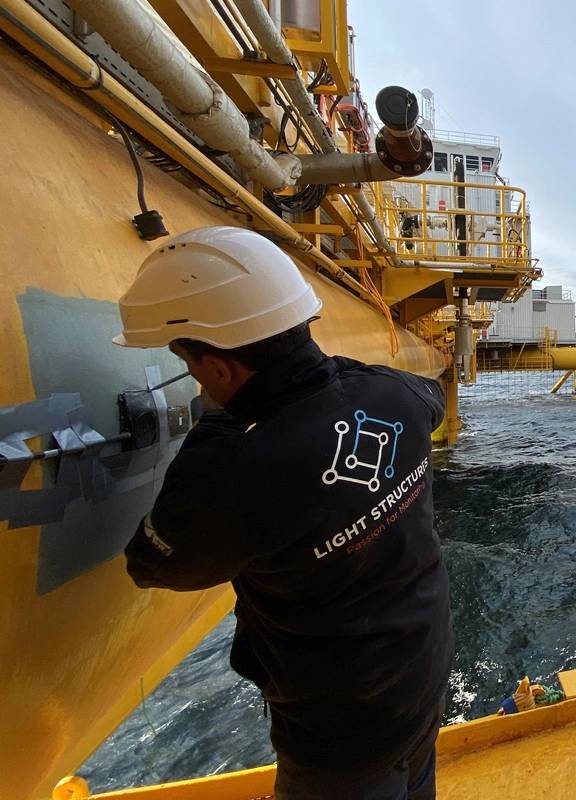 Hull stresses can be measured directly from installed sensors. Image courtesy of Light Structures.