DNV GL’s Arctic Map Shows Complex Risk Picture
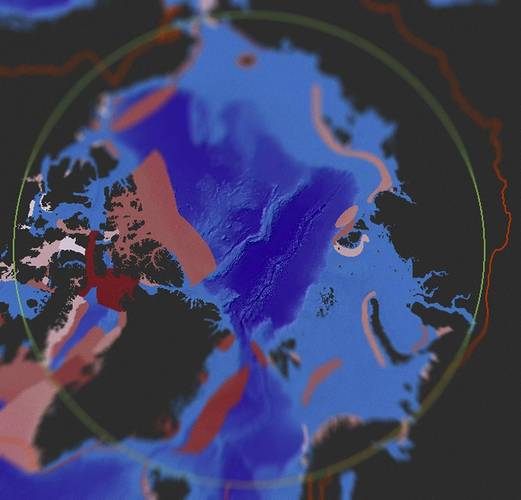
The world’s need for energy is driving interest in further industrial activity in the Arctic, yet the region’s conditions are highly variable depending on the type of activity, location and time of year. This creates a complex risk picture. DNV GL, a technical advisor to the oil and gas industry, has therefore developed an interactive Arctic Risk Map to present the risks associated with offshore and maritime activities in the Arctic. The map aims to provide stakeholders with a comprehensive tool for decision-making and transparent communications.
“The Arctic is not a monolithic area and the risk picture varies accordingly. Stakeholders therefore need a sound decision basis for understanding the risks associated with Arctic development and transportation. The DNV GL Arctic Risk Map can help facilitate transparent discussions to address the many dilemmas related to activity in the region,” said Børre Paaske, project manager at DNV GL – Oil & Gas.
The map presents multiple dimensions, such as the seasonal distribution of ice, metocean (physical environment) conditions, sea-ice concentrations, biological assets, shipping traffic and oil and gas resources, in a user-friendly, single layout. It also includes a Safety and Operability Index, showing the variation in different factors that impact the risk level depending on the season and their location in the Arctic.
In addition, a location- and season-specific index has been developed showing the environmental vulnerability of marine resources with respect to oil spill as an external stressor. In general, DNV GL’s analysis shows that the Arctic environment is characterized by seasonal variations in vulnerability, and that this vulnerability increases in the summer months along with the level of industrial activity. However, this differs greatly between regions. Some areas, for example, are particularly vulnerable in winter, when they are used by birds for wintering or as spawning grounds for fish.
As a result, the consequences of an accident in the Arctic would likely be more severe in some areas than others. The map is a useful tool to identify regions that require special attention when it comes to planning activities and for imposing mitigation measures throughout the year. The map can also provide input to decisions-makers about restricting certain types of activities in specific areas at different times of the year.
“The risk level in the Arctic must be equivalent to – or better than – the best performance in the industry today. The Arctic’s varied and complex conditions require the industry to take a stepwise approach in which learning and technology are developed progressively regarding the more challenging Arctic areas,” said Elisabeth Tørstad, CEO of Oil & Gas, DNV GL.
“As an independent body, DNV GL takes an active role in ensuring that any increase in industrial activity has a strong focus on safeguarding life, property and the environment. This Arctic Risk Map is a great example of our vision in action,” she added.
dnvgl.com/arctic


