New Carbon Footprint Dashboard for Deeper Decarbonization Insights
Decarbonization is one of the most pressing topics in the shipping industry today, and shipowners and operators worldwide are working hard to map out their plans and strategies for reducing CO2 emissions in the coming years.
To help the shipping industry get started on its decarbonization journey and reduce greenhouse gas emissions more efficiently, StormGeo now offers a new Carbon Footprint Dashboard as part of its s-Insight fleet performance management solution.
Single Source of Truth
StormGeo’s Carbon Footprint Dashboard provides a single source of all CO2 emissions data. It gives access to the analytics necessary to review the impact of implemented measures, identify corrective actions, and report on carbon intensity alignment with industry trajectories to internal and external stakeholders.
Offering a high degree of granularity, StormGeo’s dashboard can monitor various CO2 emission indicators for the entire fleet and trace them back to an individual vessel – ultimately providing deep insights into how much CO2 the company’s shipping activities emit into the atmosphere.
Specifically designed for energy efficiency and decarbonization managers but available to all s-Insight users, StormGeo’s Carbon Footprint Dashboard compiles all relevant data in one place to monitor decarbonization metrics, set carbon intensity targets, and streamline regulatory reporting processes.
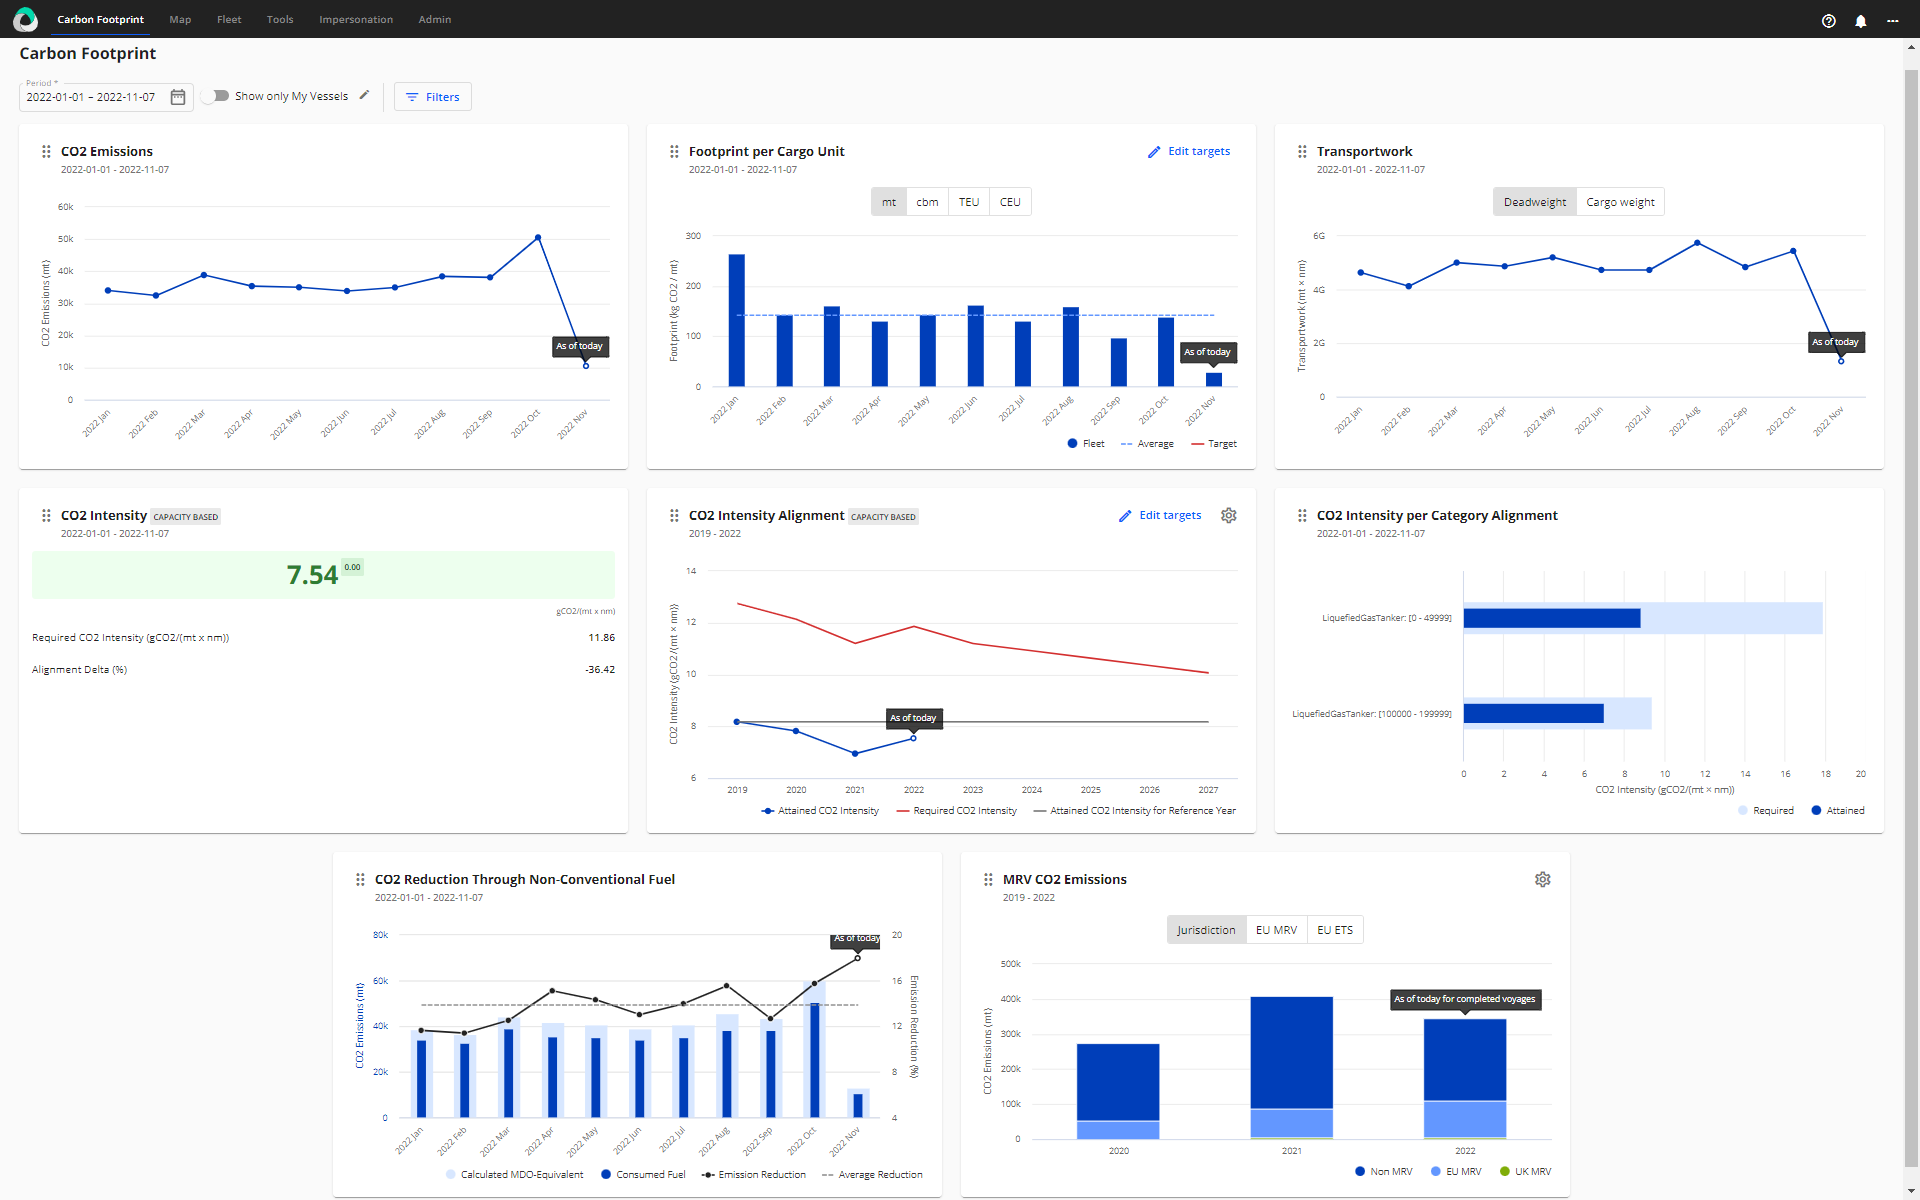
StormGeo's Carbon Footprint Dashboard
Pre-configured Widgets Monitor CO2 Emission Indicators
With several pre-configured widgets, the dashboard provides numerous graphs and diagrams to visualize the carbon footprint of all shipping activities. For example, one widget visualizes the total monthly CO2 emissions by calculating and aggregating the fuel consumption for each (completed or started) month of the selected period.
Another widget visualizes the savings on CO2 emissions by consuming non-conventional fuel, which differs from regular MDO/MGO and HFO/LFO. In contrast, another widget calculates the monthly CO2 emissions per cargo unit transported. The latter visualizes the attained emissions per cargo unit against a company-specific footprint target.
A total of seven widgets collectively calculate and display critical CO2 emission indicators for fleets, vessel subgroups, and individual vessels. The dashboard makes these insights available to all s-Insight end-users, helping to ensure transparency and improve collaboration on decarbonization initiatives across organizational departments.
Available Today
StormGeo’s Carbon Footprint Dashboard is available as part of s-Insight, a world-leading fleet performance management solution that ensures vessel compliance and provides simple, trustworthy data reporting systems.
Learn more about the Carbon Footprint Dashboard here.