Passenger Vessel Safety Record Defies NTSB Hit List
The National Transportation Safety Board (NTSB) recently released its annual “Top 10 Most Wanted List” of Transportation Improvements for 2014. New this year was the issue of passenger vessel safety. Between 2000 and 2010, several accidents involving passenger vessels occurred. Additionally, NTSB investigations “revealed in numerous cases that the cause of an accident was not the failure of the vessel but the lack of good safety practices that led to the loss of life and injuries.”
The domestic passenger vessel industry is highly regulated. Safety regulations for small passenger vessels took effect starting in 1996 for new construction, with phased implementation for existing vessels to be completed no later than March 2006. These regulations substantially upgraded small passenger vessel lifesaving equipment requirements. Since then, the defined weight of passengers on these vessels has been adjusted to 185 pounds, fully 25 pounds more than the previous benchmark of 160 pounds. Myriad other regulations also apply.
Not surprisingly, the Passenger Vessel Association (PVA), the voice of this diverse, but important sector of the domestic maritime industry, thinks that they have been painted unfairly. So does the U.S. Coast Guard’s Assistant Commandant for Prevention, Admiral Joseph Servidio, who recently praised the PVA for its strong safety record. PVA emphasizes safety in any number of ways, including the development and testing of its “Flagship” Safety Management System. The Coast Guard also says that fatalities and injuries on small passenger vessels “are very rare occurrences” and when grouped by type of accident, “there are no trends and patterns.” But, don’t take their word for it. Instead, look at the numbers:
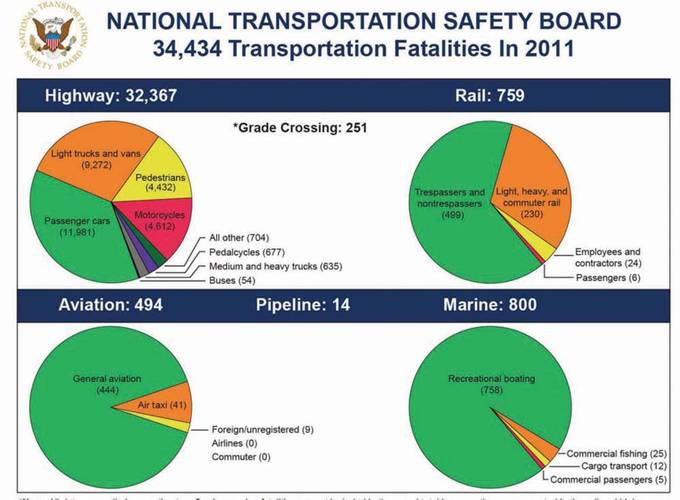
Because a single major event has a significant impact on the statistics because of historically low fatality rates in this sector, the NTSB’s own numbers are particularly useful dispelling any notions about unsafe operations. Of the 32,885 transportation fatalities reported in 2010 by the NTSB (Figure 1), just 733 happened on the water and only 17 attributable to passenger vessel accidents. That figure decreased even more in 2011 (Figure 2.). Finally, the Coast Guard also asserts that the majority of fatalities ( 83%) were not related to operation of a vessel but rather resulted from diving accidents, swimming, snorkeling or natural causes. These non-vessel-related fatalities, says the Coast Guard, stem from unregulated activities.
Based on these numbers, it’s a curious thing that the NTSB would target passenger vessels when it is clear that there are bigger problems elsewhere. For example – and echoing a previous report made is these pages (October 2013) – the Coast Guard in 1988 implemented chemical testing to discourage drug and alcohol use by vessel personnel and enhance safety. A recent study gauged the effectiveness of this chemical testing. Post-Accident drug and alcohol test results of crewmembers from two vessel categories – minimally regulated commercial fishing vessels (CFVs) with no chemical testing requirements except for Post-Accident drugs and alcohol and the other, highly regulated small passenger vessels (SPVs) of 100 tons or less with comprehensive chemical testing requirements – were compared. The drug test results that marine employers submit to the Coast Guard were also compared.
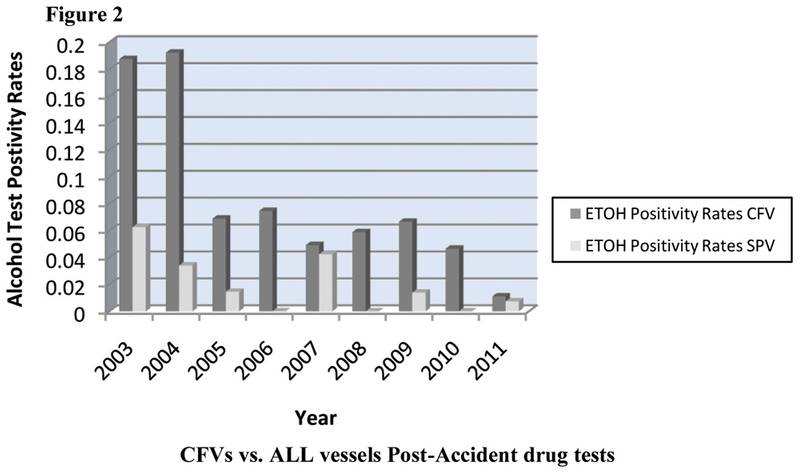
U.S. Documented small passenger vessels (SPV) – or in other words, the core of the PVA demographics – and their crewmembers are among the most heavily regulated of all U.S. documented categories. Conversely, U.S. Documented commercial fishing vessels (CFVs) are subject to the least amount of regulation. CFV’s are, however, subject to Post-Accident drug and alcohol testing – presenting a perfect contrast to SPV crewmembers for comparison. Figure 1 compares Post-Accident verified positives for one or more drugs between CFVs and SPVs from 2003-2011. Each year, the positivity rates of CFVs are higher than the positivity rates of SPVs by at least 32% and as much as 96%. SPV crewmembers averaged 77% fewer positive drug tests than CFV crewmembers. Figure 2 compares Post-Accident alcohol test positivity rates between CFV and SPV crewmembers. With minimal variations, Post-Accident alcohol test positivity rates of SPVs were lower than CFVs by at least 14% and as much as 100%. SPV crewmembers averaged 73% fewer positive alcohol tests than CFV crewmembers.
The safety record of domestic passenger vessels is very good. Arguably, it is unrivaled by any other mode in the modal transportation chains. NTSB oversight is a good thing. In this case, those resources are misdirected to the detriment of other more pressing issues lurking elsewhere.
(As published in the March 2014 edition of Marine News - www.marinelink.com)


