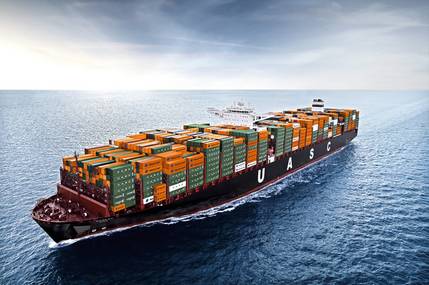
Total vessel capacity supply by ocean carriers on the transpacific trade has started increasing again, according to a report released this week by ComPair Data Inc. Weekly eastbound transpacific capacity expanded by 2 percent between January and April 2002, to 201,000 TEUs, while the latest capacity count also represents a 4-percent increase when compared to April last year.
CHART
Changes in Asia/North America eastbound capacity 2001-2002 (based on index
of 100 in April 2001) Carriers/carrier group April '01 July '01 Oct. '01 Jan. '02 April '02 %change April '01 to April '02
Evergreen/Lloyd Triestino 100 107 118 118 121 21%
COSCO/"K" Line/Yang Ming 100 107 110 114 117 17%
CMA CGM/China Shipping/Norasia 100 119 98 100 115 15%
New World Alliance (APL, Hyundai, MOL) 100 103 104 97 101 1%
Hanjin/Senator Lines 100 91 91 92 94 -6%
Grand Alliance (Hapag, NYK, OOCL, P&ONL) 100 115 118 100 102 2%
Maersk Sealand 100 100 101 78 76 -24%
Other carriers 100 122 126 126 120 20%
Total Asia/North America trade 100 106 107 101 104 4%
% change over previous quarter 6% 1% -6% 2%
Source: ComPair Data's World Liner Supply capacity reports
Several ocean carriers on the transpacific route made capacity cut-backs in the last three months of 2001, but this trend has now stopped, the April 2002 World Liner Supply report from ComPair Data shows. "It was virtually inevitable that capacity would rise again soon, and ocean carriers will likely add more new ships and capacity in the major trades during the remainder of the year," said Hayes H. Howard, President of ComPair Data.
"Shippers and intermediaries will need to track how much vessel capacity is added this year, as this is one of the drivers of the market," he added. The April 2002 World Liner Supply report from ComPair Data also identifies wide variations between carrier groups in how they changed the vessel capacity deployed in the transpacific (see table). Some carrier quarters have added capacity in each of the last four quarters, despite the problem of over-capacity. Other carriers have withdrawn services and removed capacity.
These are just some of the highlights from the latest World Liner Supply report, which tracks capacity, service and partnership changes for all liner carriers and their ships operating on 12 major trades worldwide. For a more in-depth analysis of global capacity trends, please contact the ComPair Data research staff in London by e-mailing your request to [email protected]. ComPair Data provides a free sample of the World Liner Supply reports and further information that can be downloaded from http://www.compairdata.com/wls.htm
Subscribe for
Maritime Reporter E-News
Maritime Reporter E-News is the maritime industry's largest circulation and most authoritative ENews Service, delivered to your Email five times per week


