Container Shipping a 'Mixed Bag' - Drewry

South Asia container trade with Europe continues to outpace the Middle East, says Drewry in its Container Insight Weekly report.
Container shipments in the combined eastbound Europe to the Middle East and South Asia trade performed well in the first quarter, rising by 5.2 percent year-on-year according to Container Trade Statistics. However, that aggregate rate hides two very different performances by the two destinations. CTS reports that inbound traffic to South Asia soared by 18 percent in 1Q18 to reach approximately 410,000 teu, whereas Middle East imports declined by 2 percent to land at about 590,000 teu.
The same divergent story continued into April as Europe to Middle East traffic was down by 1.6 percent, versus a 22.3 percent jump for South Asia imports.
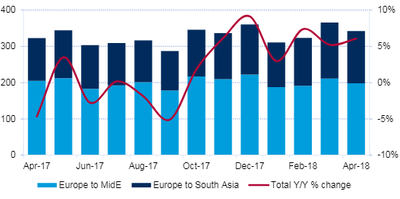 Figure 1: Eastbound Europe to MidE/South Asia container traffic ('000 teu) (Source: Drewry Maritime Research, derived from Container Trade Statistics)
There was a much more balanced picture for the westbound trade as exports from the Middle East and South Asia to Europe were much more closely aligned than they were in the opposite direction. Middle East exports rose by 10 percent in the first quarter to nearly 225,000 teu while outbound shipments from South Asia increased by 8.2 percent to about 525,000 teu.
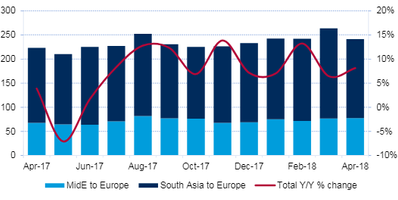 Figure 2: Westbound MidE/South Asia to Europe container traffic ('000 teu) (Source: Drewry Maritime Research, derived from Container Trade Statistics)
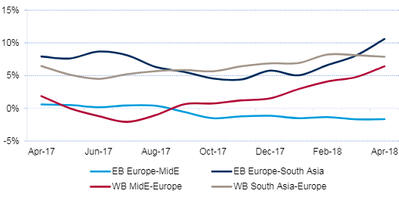 Figure 3: 12-Month Rolling Average of Europe-MidE/South Asia container traffic (% change on previous year) (Source: Drewry Maritime Research, derived from Container Trade Statistics)
After four months of 2018 the momentum is strongest for trade in both directions to/from South Asia as well as with westbound exports from the Middle East. On a rolling 12-month average basis, growth from Europe to South Asia topped 10 percent after April and 8 percent in the opposite direction. The outbound trade from the Middle East clicked up to 6.4 percent, but inbound trade is still languishing at nearly -2 percent.
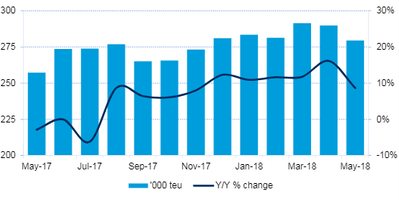 Figure 4: Eastbound Europe to Middle East capacity ('000 teu) (Source: Drewry Maritime Research)
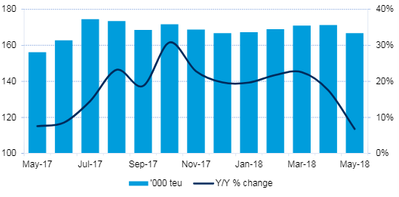 Figure 5: Eastbound Europe to South Asia capacity ('000 teu) (Source: Drewry Maritime Research)
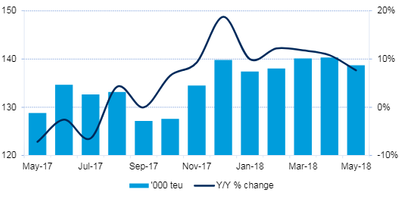 Figure 6: Westbound MidE to Europe capacity ('000 teu) (Source: Drewry Maritime Research)
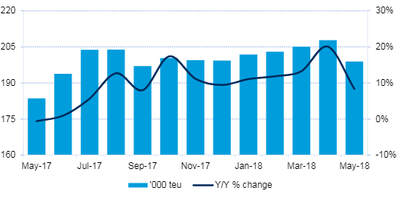 Figure 7: Westbound South Asia to Europe capacity ('000 teu) (Source: Drewry Maritime Research)
Capacity adjustments in this corridor have largely come from the addition of larger ships to existing services. Drewry notes only one new service start-up in recent months, the ME6 service (three ships of between 2,500-4,300 teu) from Maersk Line, which connects the Spanish hub Algeciras with the Red Sea ports of Aqaba and Jeddah before calling at Port Said on the return leg.
Meanwhile, MSC added two ships to its North Europe-Indian Ocean East Africa Express (now 10 ships x 5,000-8,000 teu) when it included new calls at the Baltic ports of Gdynia in Poland and Klaipeda in Lithuania. The full rotation of the service is now: Bremerhaven, Gdynia, Klaipeda, Antwerp, Le Havre, Marseilles, King Abdullah, Port Reunion, Port Louis, Mombasa, King Abdullah, Sines, Le Havre, Antwerp and back to Bremerhaven. The extra ships cater for the longer transit times rather than add any new capacity to the trade.
Spot rates from Rotterdam to Nhava Sheva have been in decline for the past 12 months. According to Drewry’s Container Freight Rate Insight 40ft container rates were $1,230 in May, which represented a drop of 30 percent on the same month one year ago when prices were at a recent high point. Rates from Jebel Ali to Rotterdam were priced at similar levels in May having been more stable over the past year.
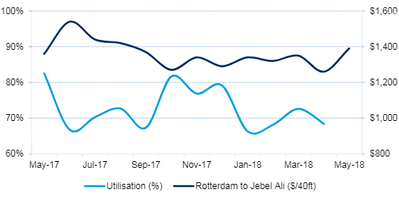 Figure 8: Eastbound Europe to MidE utilization v rates (Sources: Drewry Maritime Research; Drewry Container Freight Rate Insight)
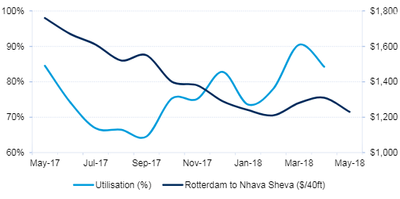 Figure 9: Eastbound Europe to South Asia utilization v rates (Sources: Drewry Maritime Research; Drewry Container Freight Rate Insight)
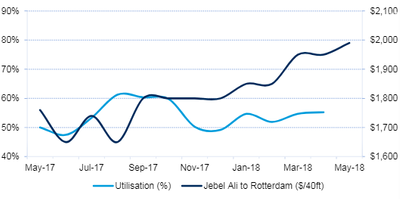 Figure 10: Westbound Middle East to Europe utilization v rates (Sources: Drewry Maritime Research; Drewry Container Freight Rate Insight)
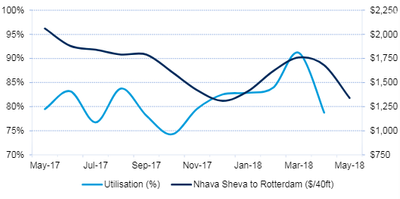 Figure 11: Westbound South Asia to Europe utilization v rates (Sources: Drewry Maritime Research; Drewry Container Freight Rate Insight)
Table 1: Europe-Middle East - estimated monthly supply/demand position
| Supply ('000 teu) | Demand ('000 teu) | Ship Utilization | ||||
| Eastbound | Westbound | Eastbound | Westbound | Eastbound | Westbound | |
| Feb-18 | 281 | 138 | 192 | 72 | 68% | 52% |
| Mar-18 | 291 | 140 | 212 | 77 | 73% | 55% |
| Apr-18 | 290 | 140 | 198 | 78 | 68% | 55% |
Notes: *Based on effective capacity after deductions are made for deadweight and high-cube limitations and then again for out-of-scope cargoes, ie. those relayed to areas outside the range. Where relevant,operational capacities have also been adjusted for slots allocated to wayport cargoes. Data subject to change (Source: Drewry Maritime Research)
Table 2: Europe-South Asia - estimated monthly supply/demand position
| Supply ('000 teu) | Demand ('000 teu) | Ship Utilization | ||||
| Eastbound | Westbound | Eastbound | Westbound | Eastbound | Westbound | |
| Feb-18 | 169 | 203 | 132 | 170 | 78% | 84% |
| Mar-18 | 171 | 205 | 155 | 187 | 90% | 91% |
| Apr-18 | 171 | 208 | 144 | 164 | 84% | 79% |
Notes: *Based on effective capacity after deductions are made for deadweight and high-cube limitations and then again for out-of-scope cargoes, ie. those relayed to areas outside the range. Where relevant,operational capacities have also been adjusted for slots allocated to wayport cargoes. Data subject to change (Source: Drewry Maritime Research)
Freight rates are likely to rise across the board for spot shippers as a consequence of higher fuel costs for carriers, but stronger fundamentals suggest the increases will be greater for South Asia.