Energy Efficiency Indices: What You Need to Know


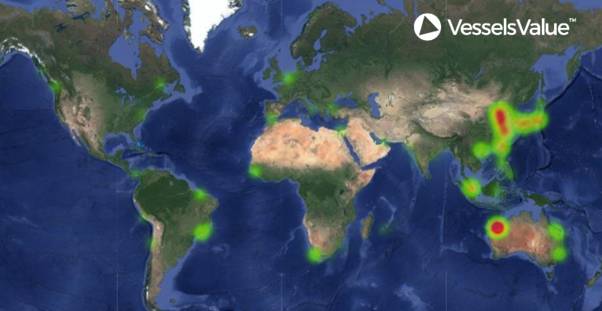 Figure 2 shows areas of high Newcastlemax activity. The red area in the North West Australia is centred on the port of Newcastle, the vessel type’s namesake. Source VesselsValue
 About the Author: Joey Daly, Cargo Analyst, Vessels Value. After graduating with a BSc. in Physics, Joey joined VesselsValue as a Maritime Analyst. Joey has been focusing on supporting the launch and the development of VesselsValue’s Green products and specialising in EEXI and CII analysis.


Decarbonization is the greatest challenge facing the shipping industry today.
The effort to reduce emissions and environmental impact extends to all sectors and players and will leave no one in the industry unaffected.
The IMO’s effort to decarbonise shipping is a numbers game. The goal, as stipulated in the Initial IMO GHG Strategy, is to reduce the average CO2 emissions per transport work by at least 40% by 2030, compared to 2008 levels., and to pursue a 70% reduction by 2050.
The introduction of the EEXI is part of the IMO’s latest attempt to achieve this goal. EEXI stands for Energy Efficiency Existing Index and is based on a previous IMO metric EEDI, the Energy Efficiency Design Index. It calculates a theoretical level of carbon efficiency based on a vessel’s design, estimating the CO2 emissions per tonne mile from engine specifications, fuel type and energy saving devices.
For every vessel above 400GT, an EEXI must be calculated and submitted – and it is no simple calculation. The below (summarised) formula gives an idea of the complexity:
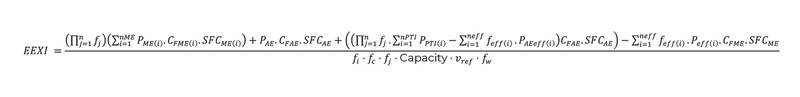
Vessels with EEXI values that exceed IMO limits will not comply with EEXI regulation.
This calculation will need to be performed individually by technical managers and class societies across the Shipping Industry and what’s more, results will not necessarily be made public.
The key to transparency is access to the right data. With access to a comprehensive vessel and transactional database, we can begin analysing fleets and sectors, and piece together what the EEXI will really mean for Shipping.
In this article we will share some of VesselsValue’s findings, visualisations, and analyses, to show just how important analytics are in the race to decarbonization.
Big Data
Shipping is a big industry, and to build a clear picture of its dynamics, you need big data. VesselsValue has made it possible to ‘Scale up’ the EEXI of an individual vessel metric to a sector-wise reflection of fleet carbon efficiency.
Figure 1. A scatter plot of vessel compliance gap vs vessel age for the Bulker sector.
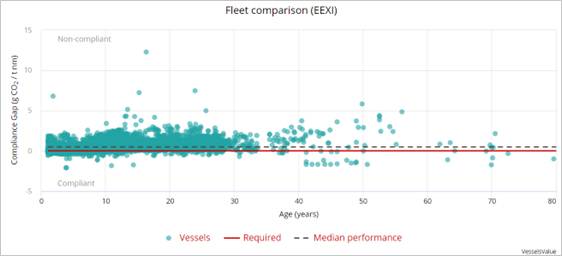
Figure 1 shows a calculated ‘compliance gap’ for every Bulker, in the VesselsValue database that has a calculated EEXI value. A ‘compliance gap’ is determined as the difference between the Attained and Required EEXI. It is plotted against vessel age to build up a compliance profile of the entire Bulker fleet and shows that the majority (87%) of the Bulker fleet are not compliant with the regulations. Source VesselsValue
Sector Analysis
With the correct mathematical infrastructure and methodology, we can go further than simply plotting a distribution, we are able to model the tangible effects of the regulation on the vessels and on their owners’ pockets.
As an example, we can look at Coal Carrying Capes between 203,000 DWT and 212,000 DWT, sometimes known broadly as Newcastlemaxes:.
Figure 2 shows areas of high Newcastlemax activity. The red area in the North West Australia is centred on the port of Newcastle, the vessel type’s namesake.
EEXI estimations show that it’s likely about 60% of vessels of this type will not be compliant with EEXI. In order to achieve compliance, these vessels will need to limit their maximum engine power, by undergoing an Engine Power Limitation (EPL) procedure.
By working backwards through the EEXI equation, we can calculate the percentage engine power reduction needed to reach compliance for every non compliant Newcastlemax, or the EPL percentage. For some older tonnage, this is as high as 17% to 18%.
Figure 3. The estimated Engine Power Limitation Percentage by vessel Build Year for the Newcastlemax Sector, plotted with Average Compliance Gap. Green line represents a negative average compliance gap, indicating compliance.
Using the widely accepted cube law relating speed and power, we calculate that the average non compliant Newcastlemax will need to reduce its speed by c.6% as a result of EPL. This speed reduction may have a direct effect on how much vessels can earn on the charter market, with slower operating vessels experiencing lower earnings.
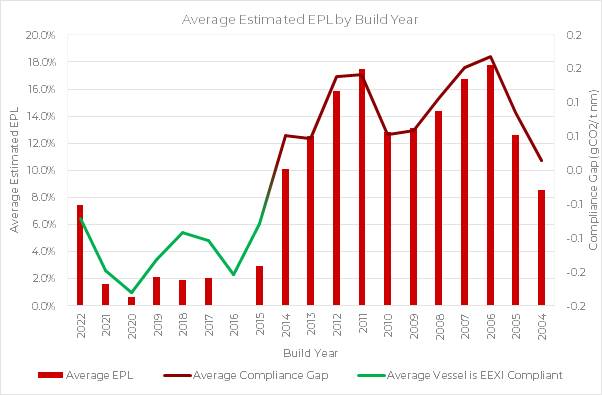 Figure 3 shows that vessels built after 2015 are, on average, compliant with EEXI regulation. This suggests that fleet carbon efficiency is improving, and IMO regulation may be having the desired affect. Source: VesselsValue
Conclusion
To improve something, you need to start by measuring it, and for Shipping to reach its decarbonisation targets, transparency is key.
The analysis in this article is just a small example of the insights available with access to the right data.
Currently, the majority of the Bulker fleet is not compliant, and achieving compliance may jeopardise earnings potentials or require ship owners to install new technology onto their vessels.
Vessels that are already compliant, however, will have better prospects, incentivising the development of a more efficient and environmentally friendly fleet.
Analytics can help make the IMO’s decarbonisation regime more transparent and more efficient and help all those involved beat the numbers game.