Tankship Asset Price Forecasting Mysteries Explained

Marine transport advisors, McQuilling Services recently released its 2014-2018 Tanker Market Outlook that forecasts spot freight rates across eight tanker classes and 13 major trading routes. This year’s edition also includes a forecast of asset prices over the same period for newbuilding, 5-year old and 10-year old tankers in these eight tanker classes. An insight into the methodology of this forecast follows:
"This note discusses an important element of McQuilling’s forecasting process – the development of tanker supply.
Tonnage supply in the tanker shipping market today must be viewed in the context of the last 45 years of marine crude oil and petroleum transportation activity. There has been a massive shift of tonnage and cargo carrying capacity away from the larger tanker sectors and towards the smaller tanker sectors over the last generation of 25-30 years.
Focusing on the last 20 years, until very recently, tonnage supply growth had continued to be virtually stagnant in some sectors as additions and deletions have effectively cancelled each other out. For example, the combined number of vessels in the VLCC, Suezmax and Panamax sectors increased by a mere 83 units from 1991 through 2004, a compound annual growth rate of 0.57% for this 14-year period.
As some sectors were slowly modernizing by the process of “out with the old, in with the new” without demonstrating measurable absolute growth, the Aframax sector showed itself over this period to be the most preferred tonnage class of all, increasing 50% in terms of the inventory of trading vessels from 1991 through 2005, a 2.8% compounded annual growth rate.
In the years leading up to 2000, significant chronic tonnage overcapacity existed in several sectors; remnants of unbridled speculative ordering from a generation before in the 1970’s. With surplus capacity eliminated, except in extreme cases, any significant and sustained responsiveness or sensitivity in freight rates stemming from changes in demand for the better part of two decades. Since about 2001, the balance of tonnage supply and transport demand has moved closer in several sectors.
However, a period of robust ordering in the 2006-2008 timeframe has again produced tonnage supply levels well in excess of demand. This was especially true for dirty tankers as illustrated below. These inventory levels are again limiting freight rate response to changes in demand.
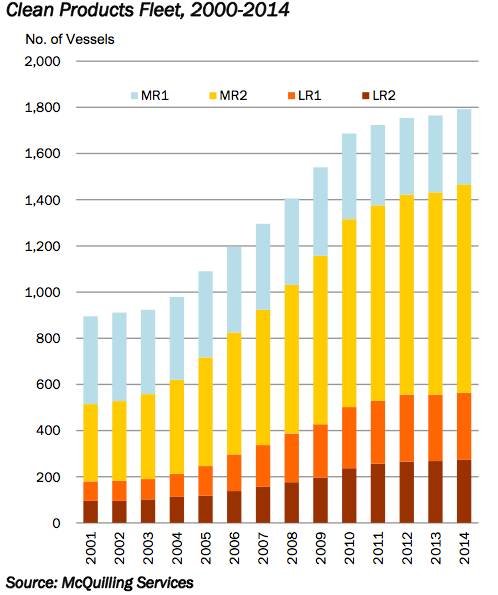
We calculate the supply of vessels capable of meeting the transport demand for each year. The results are developed from the start-of-year tanker inventory for each year. Additions to the fleet from the delivery of newly constructed vessels are added to this inventory, while deletions during the previous year (scrappings and sales into offshore conversion projects) are deducted from the beginning inventory. The net result is the ending inventory and the average inventory for the year is just the beginning plus ending inventory divided by two. For the clean sectors, we calculate supply for product carriers and IMO 3 class vessels only (see graph on the left),
The average vessel inventory figure is adjusted downward to account for the inefficiencies of the transportation system (as discussed in Industry Note No. 5 - Tanker Market Outlook – Forecast Development). We can reflect these inefficiencies by directly reducing the average annual inventory figures by the total inefficiencies implied by these factors. "
https://www.mcquilling.com/