Market Report: FPSOs ... Charting the Path Ahead
COVID-19 will continue to skew the floating production systems market for the coming 24 months, while buying power for a large portion of FPSO contracts will be centered in Brazil and Guyana/Suriname. These two areas are expected to account for more than 60% of the FPSO contracts awarded between 2021 and 2025.
These are the findings shared in a recent floating production outlook report produced by International Maritime Associates (IMA) and World Energy Reports (WER).
The 100+ page report examines business conditions likely to drive investment decisions in deepwater development over the next five years and forecasts the number and timing of orders for floating production systems through 2025.
- To request a demonstration of the database and get further information about the report and pricing options, click here.
FPSO overview
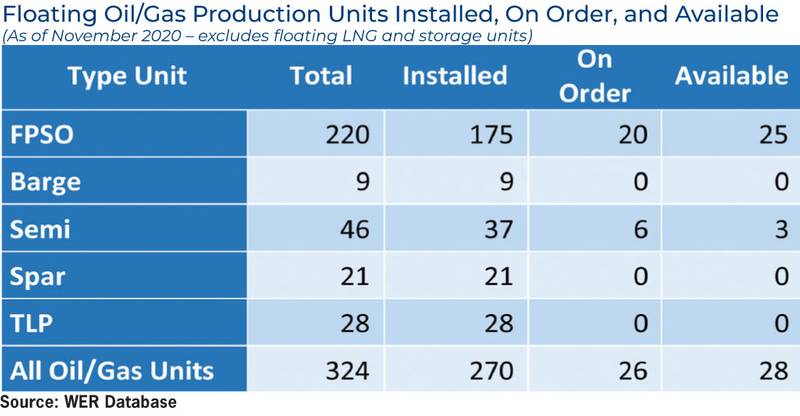
According to WER database, 220 floating production storage and offloading vessels (FPSOs) are now in operation, on order, or available. They account for 68% of the total oil/gas production floater inventory.
While all FPSOs are intended to produce, store and offload oil on offshore fields, each is designed and outfitted for use on a specific field. The result is a diverse inventory of FPSOs—with vast differences in plant processing capability, oil storage volume, mooring system design and construction cost.
Some FPSOs are small units with <20,000 b/d oil processing plants; some are mega units capable of processing 250,000 b/d. While most are ship-shaped, a few have cylindrical hulls. Some are fitted with external or internal turrets to weathervane; others are spread-moored.
Some are designed to permanently remain on field, some to be quickly disconnected.
The cost of building an FPSO ranges from $200 million to $3 billion, depending on production plant capacity, design life, local content requirement, operating environment, and other factors.
FPSOs have a number of important advantages over other production systems. The most important is their field storage capability, which allows production in locations economically inaccessible to pipeline infrastructure. Among other advantages: water depth is not a constrain, they can operate in environments ranging from benign to harsh, FPSOs can be modified and redeployed following field depletion and leasing of FPSOs has evolved into an industry-accepted procurement practice to transfer financing burden, construction risk, residual value risk and operational responsibility from the field operator to a contractor.
But there are disadvantages, too. Subsea tiebacks associated with FPSOs generally bring higher well maintenance costs. Redeploying an FPSO is not as easy as it may appear—each field is different, typically requiring major modifications to the topsides plant and mooring system.
More than 90% of FPSOs now in service are located in six major regions. Brazil accounts for 29%, West Africa 24%, SE Asia 15%, Northern Europe 13%, China 7%, and Australia 5%. The remaining 7% are spread over the Gulf of Mexico, Eastern Canada, SW Asia, and the Mediterranean.
Ownership of FPSOs is almost evenly split between field operators and leasing contractors. Field operators own 53% of the total inventory; leasing contractors own the remaining 47%.
Petrobras is the clear heavyweight in the FPSO sector. Counting both owned and leased units, Petrobras has 49 FPSOs under its control—22% of the FPSO inventory. Other major field operators utilizing FPSOs are CNOOC (13 units), ExxonMobil (12), Total (nine) and Shell (eight).
Major FPSO contractors are SBM, Modec, and BW Offshore. These three companies control 22% of the FPSO inventory.
Ownership of FPSOs as of November 2020

Growth in FPSO inventory
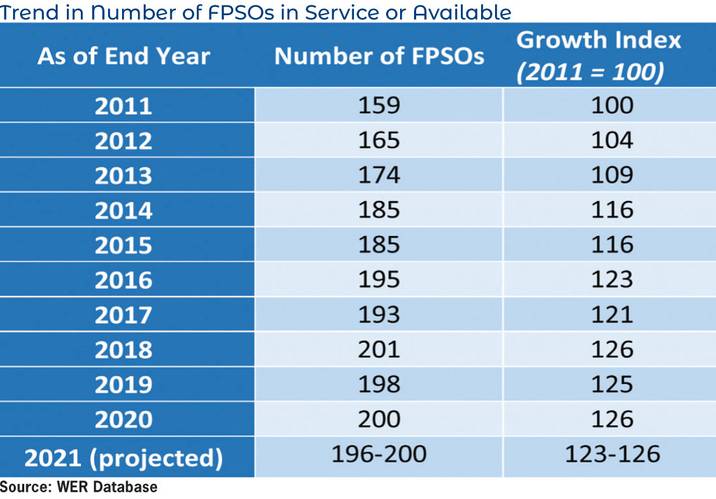
The number of FPSOs in operation or available for deployment has grown by 26% over the past 10 years—from 159 units at end-2011 to 200 units at end-2020. This reflects the net result of delivery of new FPSOs and scrapping of aging units over the 10-year period.
Expansion of the FPSO fleet has been tapering off, and the inventory of existing units has likely now peaked around 200 units. Taking into account units on order for delivery this year less FPSO removals in 2021 due to anticipated field closures, we expect FPSOs in service or available to number between 196 and 200 units at end-2021.
While another 14 FPSOs are scheduled for delivery between 2022 and 2024, the scrapping figure during the same period will likely be higher, causing the number of FPSOs in service or available to begin to slowly decline over the next two or three years. While the number of FPSOs will decline, processing capability of the overall FPSO inventory will continue to expand as incoming larger units replace smaller aging FPSOs being removed from service.
Orders for FPSOs
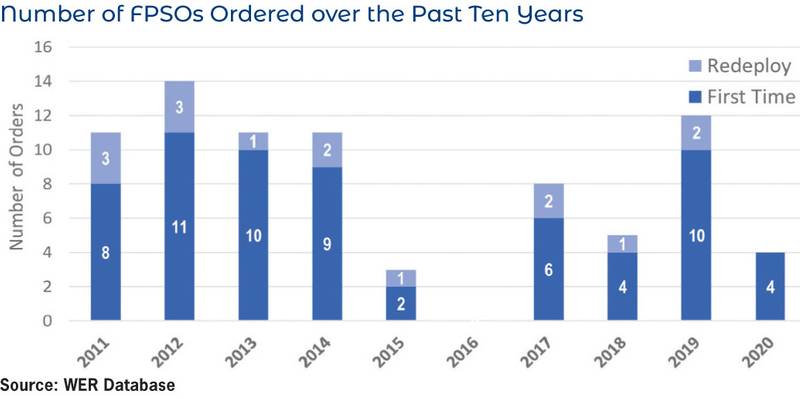
Contracts for 79 FPSOs were placed between 2011 and 2020, an average of just under eight FPSOs ordered annually. There has been big variation around this average—with orders ranging from a high of 14 contracts in 2014 to no contracts in 2016. Contracts for four FPSOs were placed in 2020—three for Brazil, one for Senegal.
All told, 64 of the 79 FPSO contracts (81%) over the past ten years entailed construction or conversion of first time FPSOs. These FPSOs have not previously operated as production units. Another 15 contracts (19%) involved redeployment of an existing FPSO to a new field. Typically the redeployment contract involves major modification of the process plant and mooring system, plus general upgrade to the entire unit.
FPSOs now being built
Twenty FPSOs are currently on order. Six are in the final stage of completion, with delivery scheduled over the next 12 months. Seven are scheduled for completion in 2022. Seven more are in the early stage of construction with delivery planned in 2023/24.
Eight (40%) of the FPSOs on order are being built for use offshore Brazil. The others are destined for Guyana (two), India (two), Mauritania/Senegal (two), UK/Norway (two), Israel (one), and Mexico (one). Two more orders are speculative FPSO hulls likely to be used on projects in Brazil or Guyana.
China is the dominant location for FPSO construction and conversion. Seventeen of the 20 FPSOs on order are partially or fully contracted to Chinese yards. Singapore has retained the second position, with at least partial involvement in two of the 20 orders. Korean yards—which had been a powerful force in this market sector—have only one FPSO contract in progress. Topsides plant fabrication and integration is spread over a variety of contractors in SE Asia, Northern Europe and Brazil.
Planned FPSO projects
As of mid-January 2021, there were 110 projects in the planning stage that could require an FPSO as a production system. Around 38% of FPSO projects in the planning stage are located in Brazil, some of which require multiple FPSOs. Africa is in second place, with 24% of planned FPSO projects. Nigeria and Angola account for two-thirds of the African projects. Other major locations are SE Asia, Northern Europe, Guyana/Suriname and Australia.
Details for all FPSO projects in the planning queue are provided in the WER online database, information that is kept up to date on a daily basis.
Projected orders for FPSOs
A bottom-up methodology was used to forecast the number of FPSO orders. We examined each FPSO project in the planning queue to determine its probability to proceed to an investment decision by end-2025. The forecast takes into account future oil prices, capex budgets, deepwater competitiveness and other underlying business drivers in each of three market scenarios—as well as each project’s status, barriers to proceeding, size and quality of reserves, operator financial strength and capex allocation strategy and other factors.
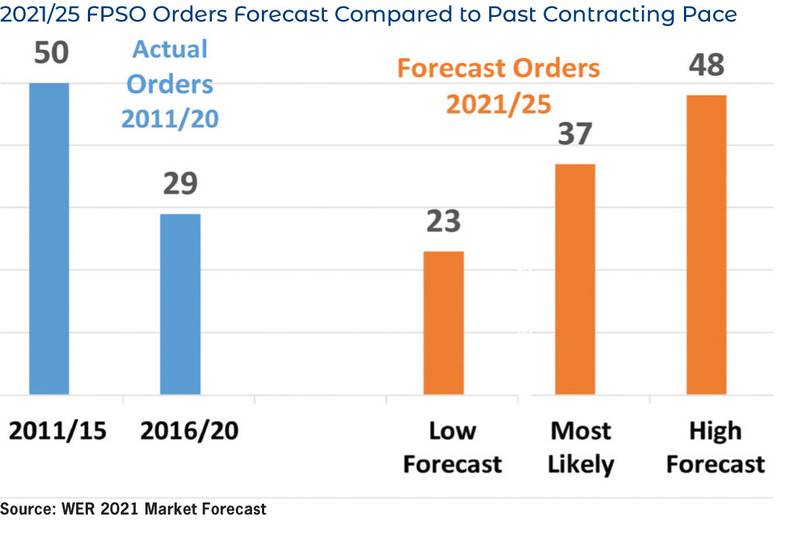
Depending on the future business scenario we expect orders for 23 to 48 FPSOs over the next five years. Our most likely forecast is 37 FPSO orders. This figure is 28% higher than the number of orders placed over the past five years, during which 29 FPSOs were ordered—but 26% lower than the number of orders during 2011/15, when 50 FPSOs were contracted.
Orders for FPSOs will be skewed toward the later years in the five-year forecast period—reflecting the expected continuing impact of the COVID-19 over at least the next two years. Buying power for a large portion of FPSO contracts will be centered in Brazil and Guyana/Suriname. These two areas are expected to account for more than 60% of the FPSO contracts awarded between 2021 and 2025. The remaining 40% of FPSO contracts will be with customers in SEA/China, Africa, No Europe, Australia and other areas.
Based on experience of the past ten years, we expect around 20% of future FPSO projects will involve use of a redeployed unit—and the number of FPSO contracts forecast in our most likely market scenario will generate a requirement for eight FPSO redeployments over the next five years.
This redeployment requirement will not absorb all of the FPSO looking for new fields. Currently, 25 FPSOs are in layup. Of the units in layup, 14 appear possibly suited for redeployment. Including FPSOs now off field and FPSOs that will likely end production by the end of 2025, there will be somewhere between 25 to 35 FPSOs available for redeployment during the forecast period—at least three times the number of likely contract possibilities.
Capex associated with FPSO orders over the next five years is projected to total $56 billion in the most likely scenario—an average capex of $11.2 billion per year.
Details for all FPSO projects in the planning stage and our assessment of which specific projects will likely lead to an EPC contract over the next five years are provided in our forecast report.
- For more information about the floating production report and online database, please visit www.worldenergyreports.com or contact Bailey Simpson @ +1 832 289-5646


