Tech Talk: Managing Ship Biofouling During Layups due to COVID-19
Biofouling control measures for ships are usually selected to match their operational profiles, and so what happens when constant service ships become idle for prolonged periods or operate at slower service speeds? Will they become vulnerable to fouling, and what measures can be taken to reduce the risk? These questions can best be answered by understanding the biology of the waters in which the vessels are located, the ecology of the different immersed parts of the ship, the biofouling control methods that have been applied or in use, the methods available to remove fouling, and the long term costs and implications associated with biofouling.
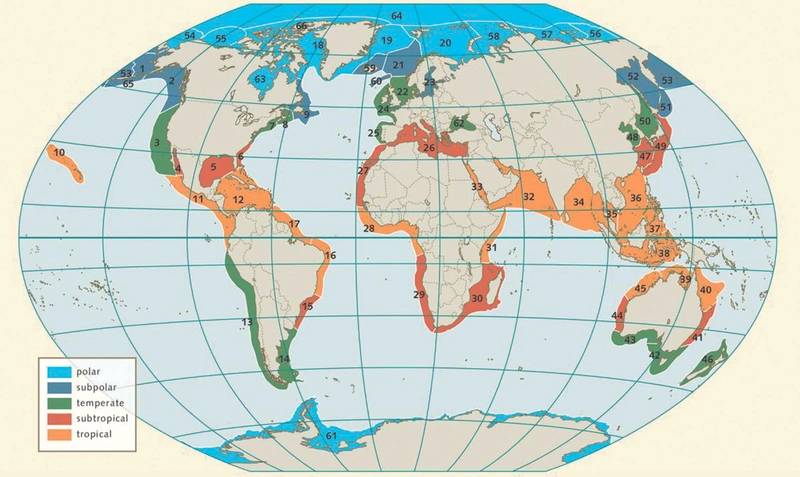
Biofouling occurs due to the presence of the mobile propagating stages of marine organisms that would normally colonize rocky shores or other hard substrates. At certain times of the year they will populate the waters at levels where any free space will be colonized, and all immersed surfaces of a ship become potential habitats. The world’s oceans may be divided into polar, subpolar, temperate, subtropical and tropical regions (Figure 1). Biofouling is typically more aggressive in warmer waters and with today’s satellite observations we are able to monitor historic and real time ocean productivity and we can identify the times of year when certain areas are biologically active.
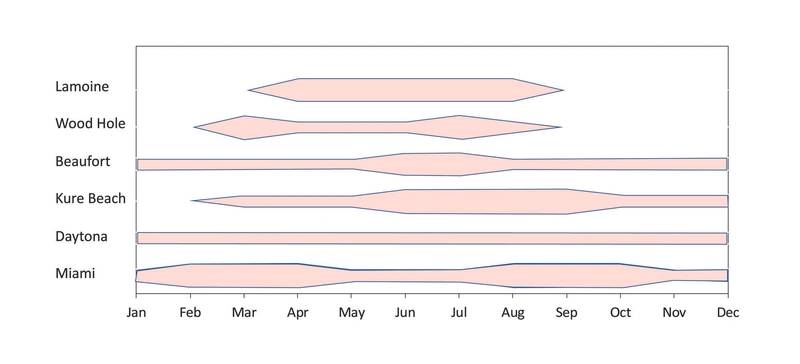
Although our knowledge about coastal ecologies is extensive, little has been done since the 1950s to translate that knowledge to a format that can be used to manage the fouling of ships and structures. In Marine Fouling and Its Prevention (1952), the differences in fouling sequence were reported for twenty different locations from around the world. Differences in barnacle settlement at locations along the east coast of the US between Lamoine, Maine (44.490N) and Miami (25.760N) (Figure 2) clearly show that the duration of barnacle settlement increases as one moves south to warmer waters.
Fouling forecasting, however, requires more detailed knowledge of local conditions and the organisms that are present. An example of the fouling conditions as measured by the organisms that were recruited to 25 x 30cm epoxy coated static immersion panels during a one-month period at our test site in Port Canaveral, Florida is shown in Figure 3. The data shows a diversity of different fouling types and the summer months have more active fouling than in the winter.
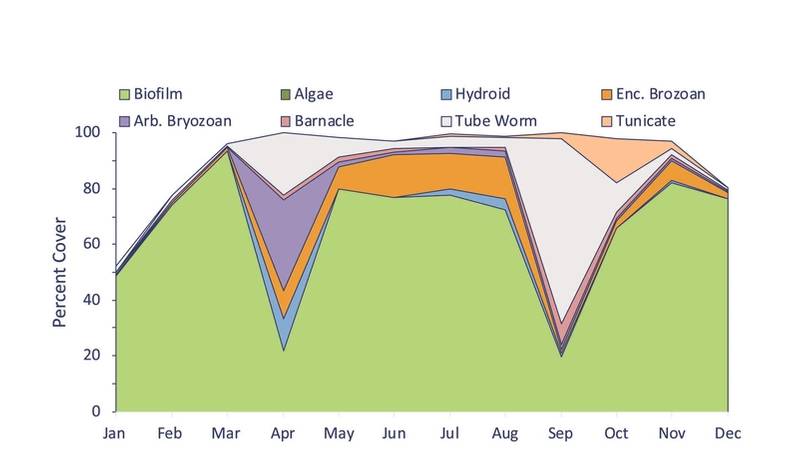 Figure 3. The seasonal sequence of fouling on 25x30cm epoxy coated panels immersed for one month at Port Canaveral, FL. Image: The Author
John de Palma (1972) promoted the idea of fearless fouling forecasting and used data collected from Fort Lauderdale and other areas to create a fouling rate zone chart. He proposed that in warm water coastal areas, fouling is greatest closest to the coast and decreases as one moves seaward to deeper waters (Figure 4).
Ships and structures develop their own ecology due to the location, geometry, activity and the fouling control measure that is applied. These may be divided into the general hull and niche areas (Figure 5). The bulbous bow and sides of the hull typically develop biofilms and weed fouling, whilst the flats often have barnacles. The niche areas offer sites that are sheltered from water flow and these are ideal sites for barnacles, tubeworms and mollusks. The International Maritime Organization Resolution MEPC.207(62) contains guidelines that recommend every ship have a Biofouling Management Plan and a Biofouling Record Book onboard. These recommendations are now required for ships visiting Australia, New Zealand and California and will provide excellent guidance in making decisions with respect to biofouling control.
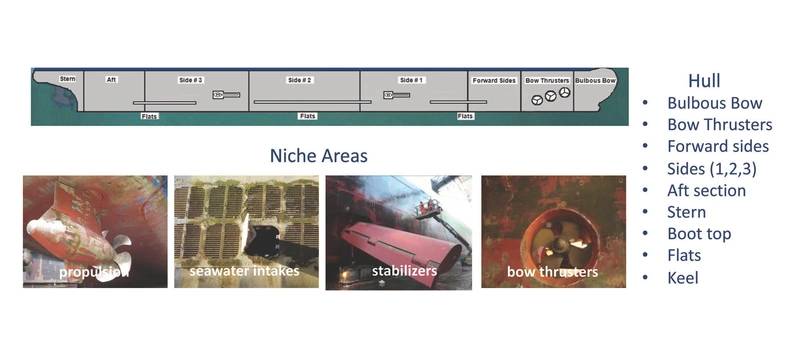 Figure 5. The general hull and niche areas of a ship. Image: The Author
Fouling control coatings provide the most commonly used method of protection to immersed surfaces. These may be divided into those that function by the release of a biocide and those that reduce biological adhesion to the surface. For biocide-based coatings, the active ingredients are held within a paint matrix that is designed to control the release at the minimum rate required to prevent fouling. The formulations are typically tailored to specific operational profiles and changes to the ship routine may alter the release of active ingredients and performance. For copper, the optimum release rate is generally considered to be between 10-20 µg/cm2/day, however, under static conditions the lack of water flow and the buildup of silts and slimes will reduce copper output to a level at which macrofouling may develop. There are also certain organisms that exhibit copper tolerance. This was first observed by Weis from research he did in Biscayne Bay, Florida in the 1940s. He identified the barnacle Balanus amphitrite and the encrusting bryozoan Watersipora cucullate as copper tolerant species, and these are typical of the early colonizers of copper-based coatings.
The silicone-based fouling release coatings are designed to reduce the adhesion of organisms to the surface. Typical barnacle adhesion strengths to these coatings are between 0.02 to 0.06 MPa compared to values greater than 1 MPa for other coatings (Figure 6). This means the force required to remove a 10mm diameter barnacle from a fouling release coating may be as low as 1.5 Newtons (0.3lbs) compared to in excess of 80 Newtons (18lbs) for non-release coatings and surfaces. When the adhesion strength is greater than the strength of the barnacle shell, then hull cleaning typically leaves the barnacle base plate which roughens the surface and acts as a future site for settlement. For constant service ships, the shear stress developed by water movement across the surface of fouling release coatings is sufficient to remove juvenile macrofouling. Under prolonged static conditions, however, the fouling organisms can get a sufficient hold to make removal difficult and barnacles have a tendency to undercut the coating which increases adhesion strength and damages the surface.
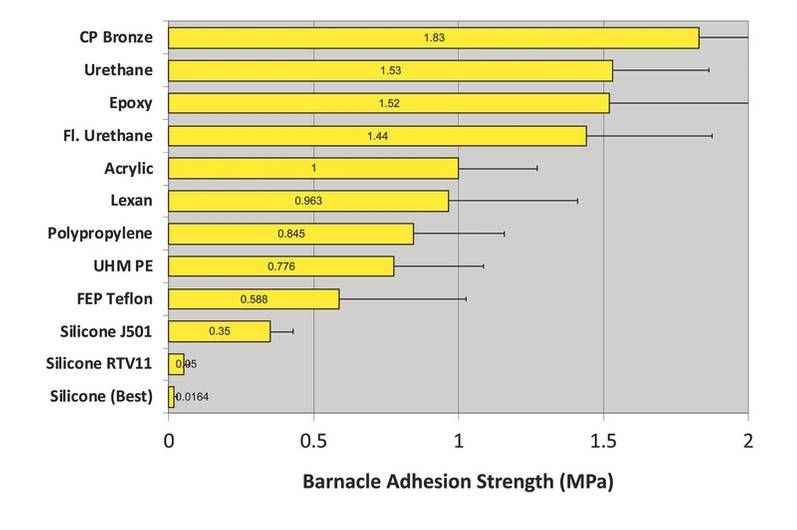 Figure 6. Barnacle adhesion strength to different materials. (taken from Swain, Redefining Antifouling Coatings. Journal of Protective Coatings and Linings September 1999). Image: The Author
Ships that remain stationary for long periods of time are therefore likely to become fouled. As the organisms grow, so will the forces required to remove them increase, and it is why proactive removal of the marine growth is critical if one wishes to avoid damage to the coating. The exact nature and timing of the growth are difficult to predict due to the large number of variables that will determine the event (Figure 7). Forecasting the development of fouling requires knowledge of the ship operation and schedule, the local conditions, and the age and condition of the fouling control coating. This knowledge should then be communicated with the coating supplier for their advice.
The ship owner has only limited choices as to how to manage fouling. Selecting a location with low fouling pressure is important. This may be achieved by voyage planning that places the vessel in an advantageous location, but if this is not feasible, then local knowledge may be used to identify the locations with reduced fouling. The ship should then be monitored for biofouling recruitment. This may be done using an ROV to visually inspect surfaces. Another option is to hang sentinel epoxy coated panels over the side to ascertain what fouling organisms are present. If biofouling is active then a decision must be made whether to engage in proactive maintenance of the coating or reactively let it foul and clean the vessel once it resumes service. Proactive measures include running the vessel up to a certain speed for a predetermined time at a frequency that maintains the activity of the paint or removes the incipient organisms. Another choice is to light clean or groom the vessel at a frequency that removes the fouling before it becomes established. Our experience in the summer high fouling season at Port Canaveral, Florida is that the fouling control coatings require a light cleaning (grooming) on a weekly basis to ensure that they remain free of fouling (Tribou 2015 and Hearin 2015).
Ship hull grooming is ideally done using remotely operated vehicles but at present, the decision to rely on in water husbandry will require the services of a diving company with the method to match the fouling and the coating. Hull cleaning is also becoming highly regulated. There are an increasing number of areas in the world that do not permit hull cleaning or have regulations that limit the amount of discharge that is created by the process (Scianni 2019).
Finally, there are the costs associated with biofouling and these include both monetary and environmental penalties. Failure to prevent fouling will reduce ship performance, increased greenhouse gas emissions and the danger of transporting invasive species. If the fouling is allowed to become well developed, then the subsequent hull cleaning is likely to damage the coating which will cause excessive discharges of the paint into the water, reduce or eliminate the effectiveness of the coating and require dry docking. All are undesirable outcomes. It would therefore seem prudent to proactively manage the coating by selecting an anchorage that minimizes the problem and apply proactive methods to maintain the coating in a clean and active condition.
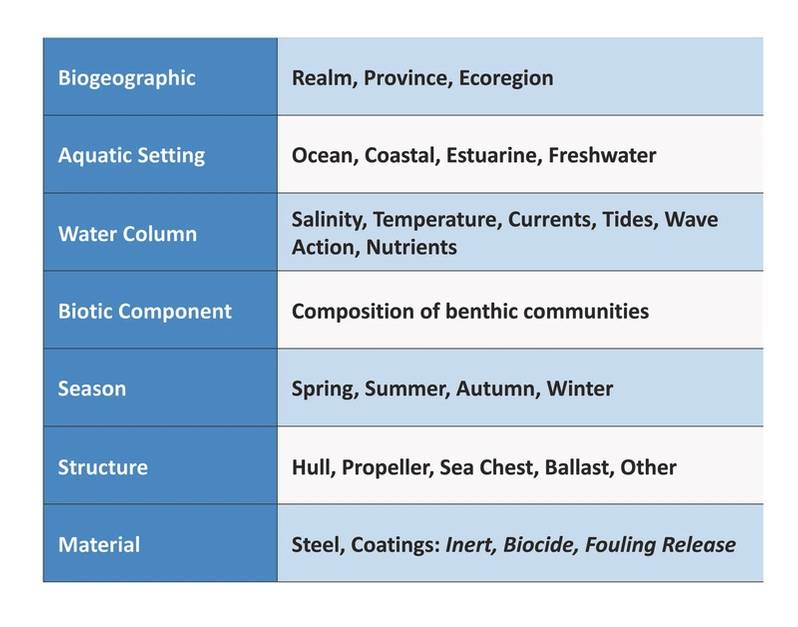 Figure 7. Factors that influence the development of biofouling. Image: The AuthorAcknowledgements: The author would like to thank the Office of Naval Research Environmental Quality Program for their continued support of research and the staff and students at the Center for Corrosion and Biofouling Control for their inspiration and hard work.
References
1.World Ocean Review Living with the Oceans. 5 Coasts – 2017
2.Redfield and Deevy, The Seasonal Sequence. Marine Fouling and Its Prevention 1952
3.DePalma J. Fearless Fouling Forecasting 1972
4.International Maritime Organization Resolution MEPC.207(62)
5.Weis C. The comparative tolerances of some fouling organisms to copper and mercury. BioI. Bull, 93, 56-63. 1947.
6.Swain, Redefining Antifouling Coatings. Journal of Protective Coatings and Linings September 1999
7.Tribou M, and G Swain. Grooming using rotating brushes as a proactive method to control fouling. Biofouling 31, No. 4, 309-319 May 2015
8.Hearin J. et al. Analysis of long-term mechanical grooming on large-scale test panels coated with an antifouling and a fouling-release coating. Biofouling, 2015 Vol. 31, No. 8, 625–638
9.Scianni C. and E. Georgiades. Vessel In-Water Cleaning or Treatment: Identification of Environmental Risks and Science Needs for Evidence-Based Decision Making. Frontiers in Marine Science 6:467, June 2019


