

Dry Bulk Back from the Brink


 Photo: Dennis Schnell, Bulldog and Partners
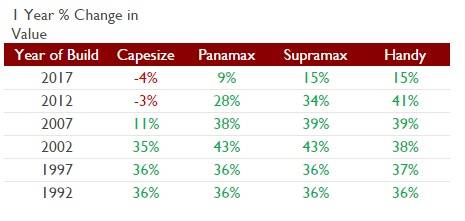 Image: VesselsValue
 Image: VesselsValue
 Image: VesselsValue
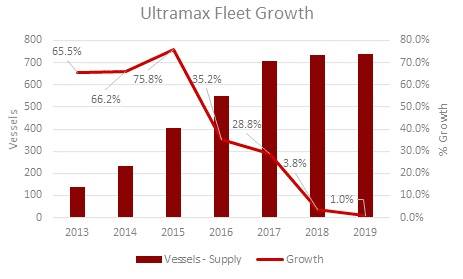 Image: VesselsValue
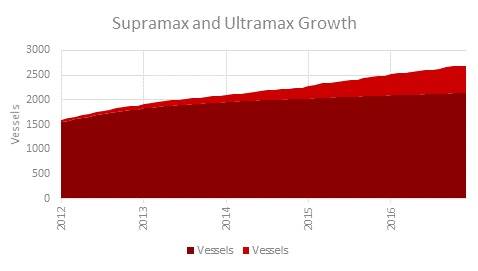 Image: VesselsValue
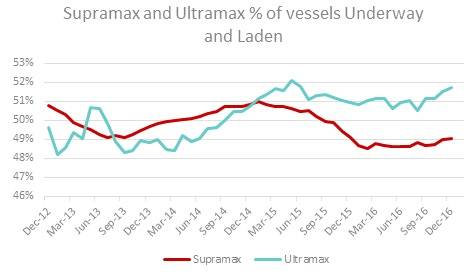 Image: VesselsValue
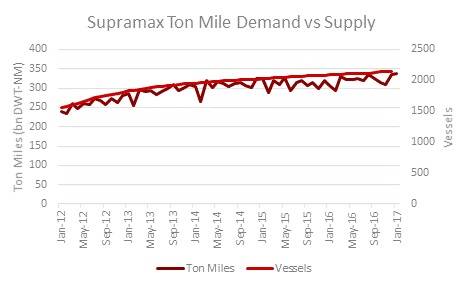 Image: VesselsValue
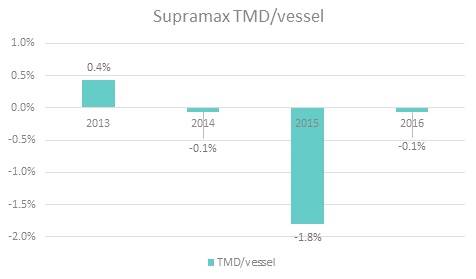 Image: VesselsValue


While the tanker industry worries about OPEC reducing output and the container industry rushes to consolidate, dry bulk values have been quietly increasing. VesselsValue senior analyst William Bennett digs through the data to uncover the reasons why.
Bulker values in the last 12 months have hit rock bottom and are now looking to show considerable promise. Five-year-old handysize values are up by over 40 percent; as are 15-year-old Panamax and Supramax asset prices. Pre-2002 built Capes are up by around 35 percent since February 2016.
To put the opportunities in perspective, a 2012, Korean-built handysize bulker was sold at $6.2 million. Today that vessel is worth $12.3 million. Also of note is the Panamax Songa Maru, (2008-built, Tsuneishi Zhoushan). The vessel was bought by Wilmar at $7.8 million in March last year and was transacted again only six months later at $11.3 million.
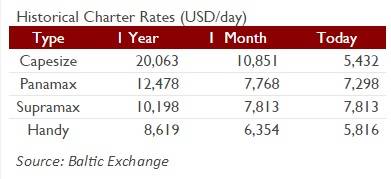
Charter rates have not had the strong rebound that values have. Many are lower now than they were both a month ago, and year ago. In February, the Baltic Capesize Index fell below standard OPEX (c. $6,500 /day) to sit at a spot rate of $5,432 /day. Despite this the Capesize period charter market is up. A recent example is a 2015-built, Hyundai Mipo Cape being done at $14,500 /day, the highest seen in period charters since 2015.
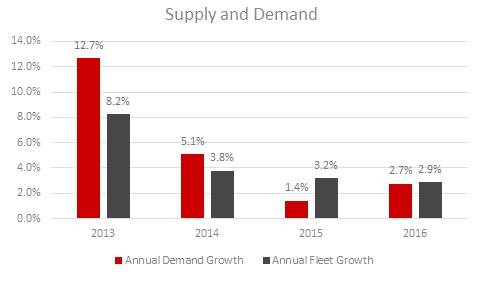
The Supramax sector saw some of the highest gains. Average increase in asset prices across the sector was 31 percent. The sector has seen fleet growth slowing considerably. Growth in 2016 was only 2.9 percent down from 8.2 percent in 2012. This can be attributed to the emergence of the market for Ultramaxes. In 2015 there was 75.8 percent growth in for Ultramaxes that shrunk to a more manageable 35.2 percent in 2016.
The result of this growth in the Ultramax sector means demand growth for Supramax has been slowing. From 2012 to 2013 seaborne demand for Supramaxes grew by 12.7 percent. Fast forward to 2016 and this figure shrunk to 2.7 percent. This hasn’t been god news for the sector. At the beginning of 2015 the percentage of vessels in the Supramax fleet that were underway and laden sat at 51 percent. Today that is lower at 49 percent. Looking at ton miles per vessel (a measure which analyses the effect of supply on demand), this shrunk by 1.8 percent in 2015 and continued to shrink marginally in 2016 (-0.1 percent). This clearly shows how the Ultramax has begun to take hold and steal Supramax cargoes, however Ultramaxes are also feeling squeeze as ton mile demand per vessel growth slowed from 1.8 percent in 2015 to almost half at 0.8 percent in 2016.


