

Container Fleets & Demand Growing in Step -BIMCO


 © Mihai Andritoiu / Adobe Stock
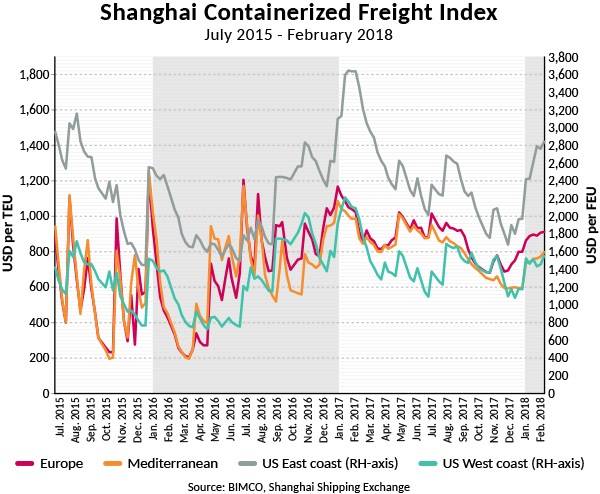 (Source: BIMCO, Shanghai Shipping Exchange)
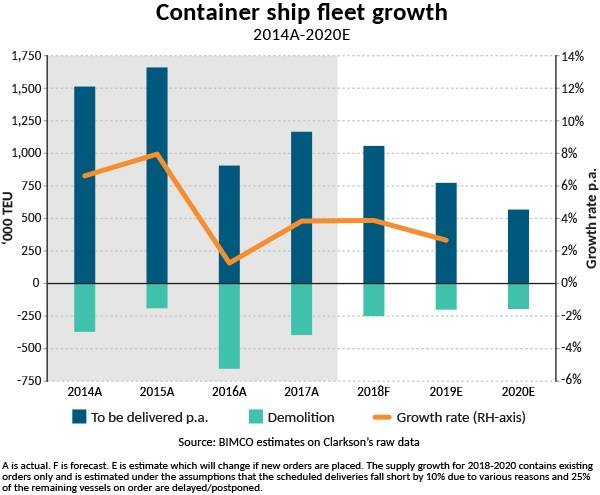 (Source: BIMCO, estimates on Clarkson’s raw data)
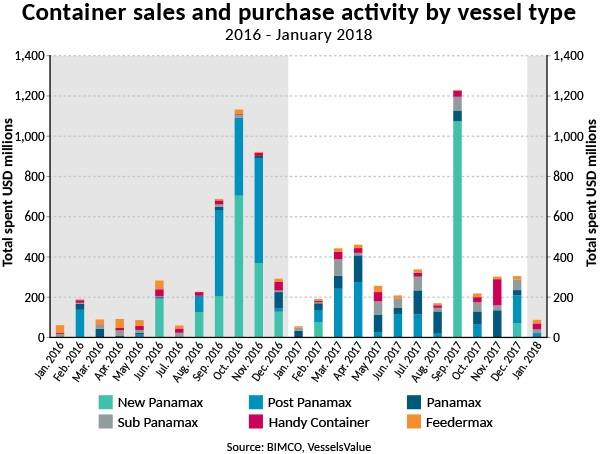
 (Source: BIMCO, VesselsValue)
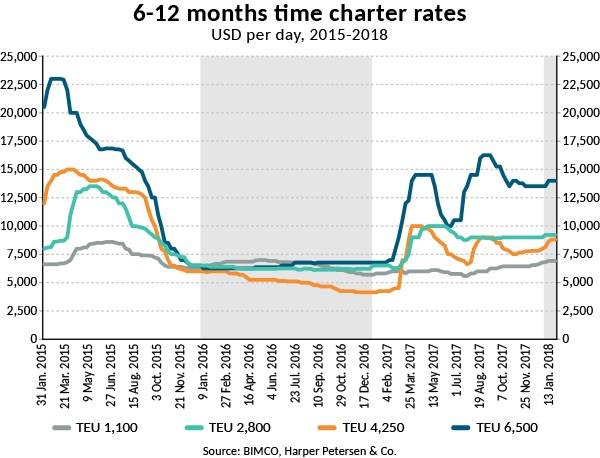 (Source: BIMCO, Harper Petersen & Co.)


For 2018, the world containership fleet is expected to grow in step with global demand, according to BIMCO’s latest container shipping market outlook.
Demand
Having experienced falling freight rates from August to year-end in 2017, most liner companies were successful in pushing rates higher in early January 2018. Most of them managed to hold onto most of the gains they achieved, considering October and November were challenging in terms of very low demand growth. The weak demand came from the Far East to Europe trade, and on the Intra-Asian transport.
Liners were the most successful at maintaining higher freight rates on the U.S.-bound trade lanes, both East and West Coast. On the other high-volume trades into the Mediterranean and North Europe, the announced General Rate Increases (GRI) lifted freight rates too, but to a smaller extent.
Liners always push for higher freight rates going into January. But, as fleet growth had overtaken demand by a large margin in the latter third of 2017, rates had been falling for six months going into January. Nevertheless, exports ahead of Chinese New Year in mid-February 2018, boosted demand to such an extent that rates into the U.S. East Coast went up at the start of January 2018 and kept rising.
Most containers are moved on shorter hauls intra-Asia. For the full year of 2017, data provider CTS counted 40.9m TEU being transported between different Asian ports (+4.3 percent Y/Y). On the most important long-haul trades, CTS counted 18.5m TEU going from the Far East into North America (+7.3 percent Y/Y) and 15.8m TEU on the routes from the Far East into Europe (+3.7 percent Y/Y).
Demand also grew on the Far East to Sub-Saharan Africa trades, +5.9 percent for the full year of 2017 (2.8m TEU). Another ”lower volume trade” that grew strongly in 2017 was the Far East to South and Central America trade lanes – shipping 3.6m TEU during 2017, up by 10.7 percent on last year.
Either way you look at it, 2017 was a strong year.
We always focus a lot on the front hauls – for good reason. Cargoes on the back hauls often only provide a bit of revenue to cover some of the costs of bringing the containership back to the Far East for another profitable pay load.
On January 1, 2018, a Chinese ban on specific imports came into effect. The ban covers the import of 24 types of waste, including waste paper and waste plastics. Commodity categories like “ores and scrap”, “pulp and waste paper” and “plastics in primary forms” often feature now amongst the top five commodities on many trades, with Asian-bound trades dominating.
At least for a while, the ban has turned the attention of industry and shippers back to the back-haul cargoes.
On the trade from North America to Asia, the number one commodity – by a margin – is “pulp and waste paper” accounting for 1.46m TEU in 2017 (source: MDST), with an estimated global total of 4-5m TEU that could be affected by the Chinese ban (source: Drewry). The volumes are not expected to be an outright loss. Much of the affected cargo seems to be heading for Indonesia, Taiwan and Vietnam. However, not all this type of cargo can expect to land there, as the now “unavailable” waste handling capacity in China is much bigger than the other waste handling facilities in the Far East combined.
Supply
The containership fleet has already expanded by 1.2 percent in the first month of 2018 – equal to the entire fleet expansion of 2016.
A flurry of new ships has been delivered in January. Not since July 2010 has such a massive inflow of capacity taken place in one month – 254,173 TEU. This includes plenty of feeder ships but also five ultra-large 20,000+ TEU ships. On the demolition side, three ships have been removed (a 320 TEU ship built in 1981, a 976 TEU ship built in 1990 and a 3,802 TEU ship built in 1998).
2017 saw a total of 398,000 TEU demolished, a level which is bound to decrease in 2018. BIMCO expects that 250,000 TEU will leave the fleet as the year progresses. Bringing a fleet growth of 3.9 percent as the newbuilt delivery is forecast to reach 1.05m TEU.
In 2018, the focus will be on the deployment of ultra-large containerships. 53 ships larger than 13,500 TEU are scheduled for delivery – we expect around 40 of them to be launched. In 2017, 55 ships of the same size were scheduled for delivery but only 43 were delivered.
New orders are also being placed at an increasing pace. The break in ordering from December 2015 through August 2017 was one to cherish.
The idle containership fleet has almost disappeared. Alphaliner counts only 65 ships on their list with a combined capacity of 191,441 TEU as of February 5, 2018. In real terms, this means that nominal fleet growth will have a bigger effect on the market balance, as the temporary idling and re-activation of ships becomes negligible.
Owners and investors were busy in the second-hand market in 2017. In fact, it was the busiest year on record. 297 ships changed hands, valued at $4,178m (source: VesselsValue). Panamax ships were in demand, more due to price than anything else – with 93 ships changing hands in total. Purchasing prices were equal to the demolition values of many of the ships, meaning there was little downside risk from the purchase. Since mid-2017 both demolition prices and second-hand values have gone up.
It all depends on timing - a 2009-built panamax ship (4,275 TEU) was valued at $13.7m in July 2016, $5.6m in January 2017 and $10.9m in January 2018. At the same time, the demolition value of the same ship was $4.6m, $5.6m and USD 8.1m. Meaning that deals done at January 2017 prices were equal to demolition values.
Outlook
The fact that demand growth slowed down toward the end of 2017 is also clear from the development in time charter rates, which peaked twice last year, around April/May and around mid-September 2017. Nevertheless, the upward trend was an encouraging one, as the dip following the second peak was not as low as the previous dip. For a 6,500 TEU ship, that development took time charter rates from $14,500 per day in April 2017, down to $10,000 per day in June and back up to $16,250 per day in September 2017. By early-February the rate was at $14,000 per day again. In all aspects time charter rates were mostly lossmaking – but 2017 did deliver considerably higher rates in comparison to the absolute lows of 2016.
What will the future bring? Overall demand growth is expected to be lower than in 2017, but still high enough to potentially improve the fundamental market balance. BIMCO forecasts demand to grow by 4.0-4.5 percent against a fleet growth of 3.9 percent in 2018. The IMF January update of its World Economic Outlook, significantly lifted expected GDP growth in advanced economies for 2018 and 2019, and growth in advanced economies is generally good for container shipping demand.
Watch out for the North American inbound loaded containers where we expect a change in 2018. We saw very strong growth in 2016 and 2017 for the U.S. West Coast imports and in 2015 and 2017 for the U.S. East Coast imports. We have yet to see the full effect of the elevated Bayonne Bridge allowing ultra-large containerships to pass and enter the New York/New Jersey (NYNJ) port. Loaded containerized imports into NYNJ were up by 6 percent for the full year of 2017 compared with the year before.
For the whole of the U.S. East Coast in 2017, the amount of inbound loaded containers grew by 10.1 percent. It took the industry a while to embrace the expanded Panama Canal locks – but they are making use of them now. 2018 is likely to be the year where many container line networks calling the U.S. East Coast will become fully up-scaled by deploying ultra large containerships.


