Record Year for US East Coast Container Imports


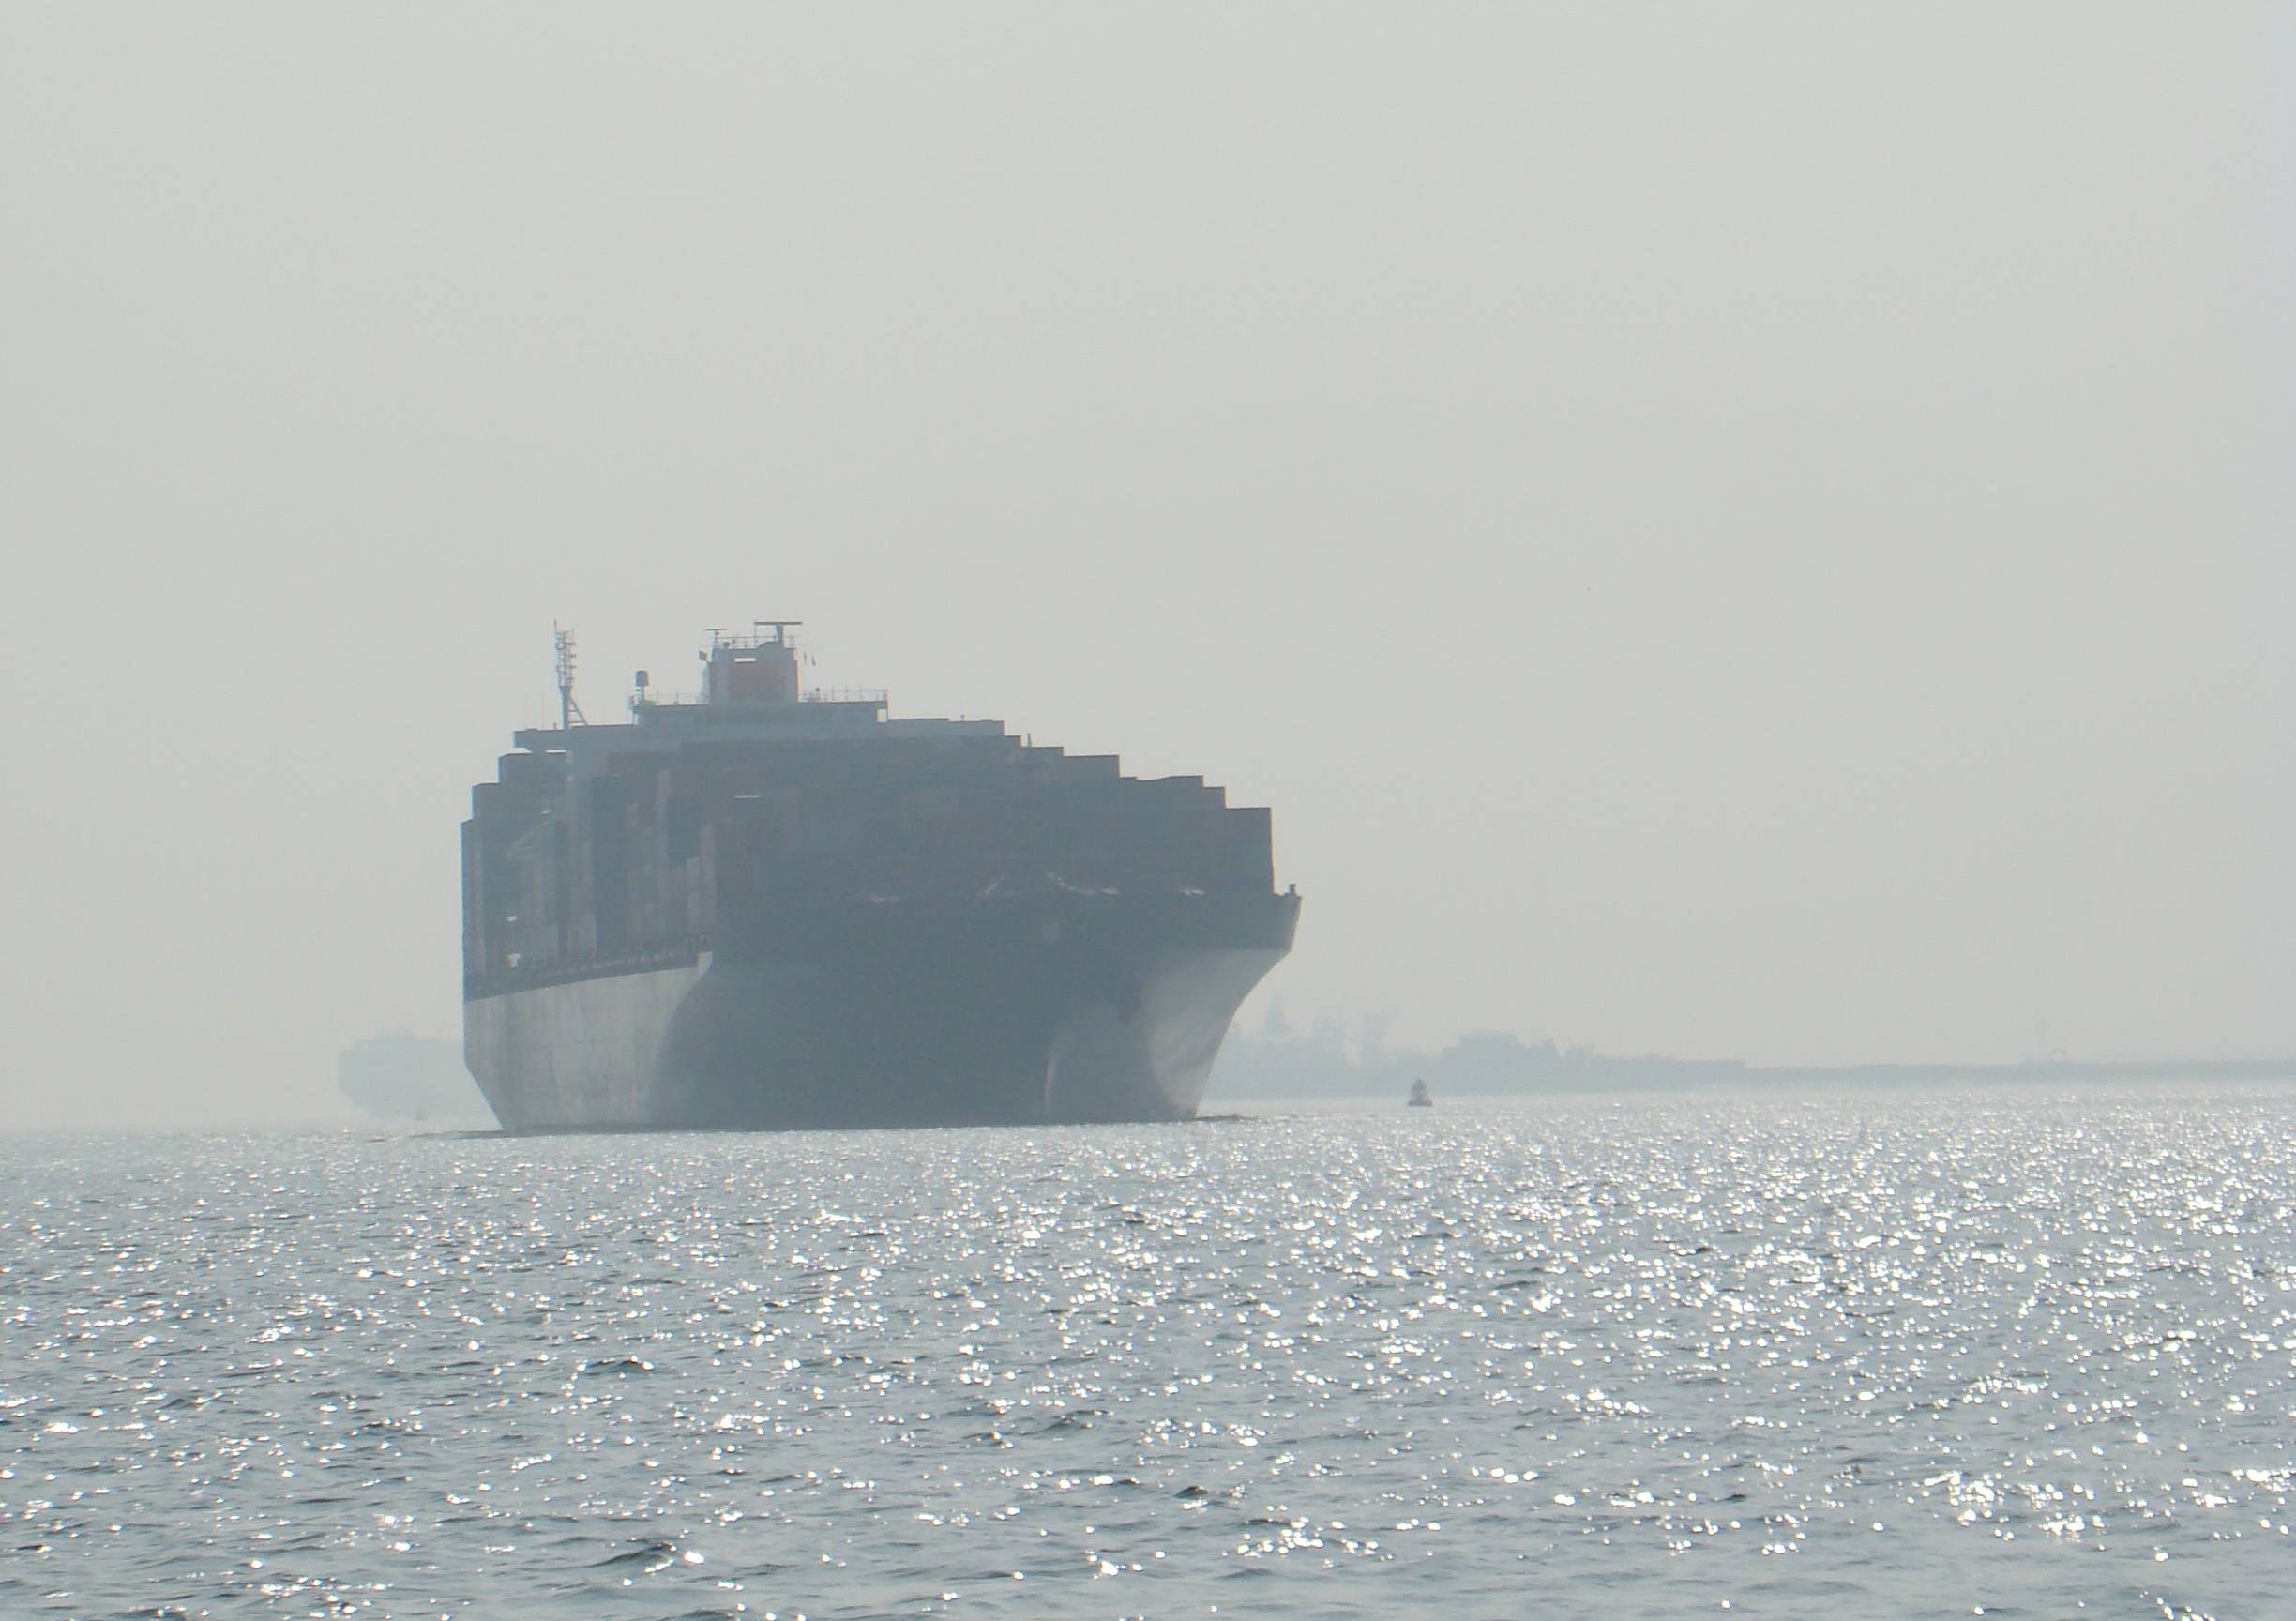
 Photo: Greg Trauthwein
 Peter Sand (Photo: BIMCO)
 Source: BIMCO
 Source: BIMCO

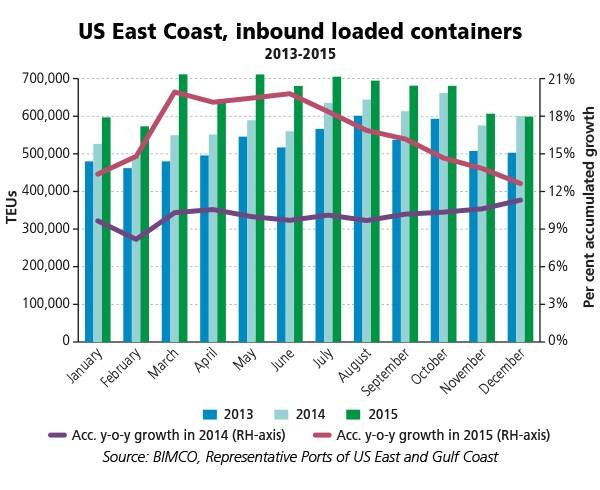

Ports on the U.S.’ eastern coast had a very busy 2015 in terms of container traffic, with 7.9 million TEU of loaded containers entering the U.S. East Coast in 2015, a 12.6 percent increase compared to 7 million in 2014, BIMCO reports.
While the U.S. East Coast ports experienced a surge in incoming traffic, labor issues and port congestion gloomed over the U.S. West Coast.
The start of 2015 was dominated by the ongoing contract negotiations between the International Longshore and Warehouse Union (ILWU) and the Pacific Maritime Association (PMA). The conflict between the two parties led to substantial congestion at ports on the western coast, with dozens of ships anchored waiting for berths to open.
Chief Shipping Analyst, Peter Sand said, “As the conflict on the U.S. West Coast dragged out, some of the traffic was diverted to U.S. East Coast ports. These ports benefitted greatly from the diverted traffic but also from the fact that this happened at a time when personal consumption of goods in the U.S. was on the rise.
“According to BIMCO’s data for 2015, U.S. East Coast ports handled almost 900,000 TEUs more than in 2014. A rise of 12.6 percent,” Sand noted. “Imports via U.S. West Coast ports rose at 0.4 percent”
“Going forward, one of the big questions will be whether or not the U.S. East Coast ports can hang on to this new business,” he added.
Imports peaked in March
BIMCO’s U.S. East Coast traffic data is based on a group of ports selected as a representative proxy for the region. When looking at the growth in 2015 on a monthly basis, the inbound loaded traffic was higher in the first 11 months of 2015 compared to 2014. Imports peaked in March with 711,000 TEU of loaded containers - almost 30 percent higher when compared to March 2014. Only in December did traffic underperform, declining 0.2 percent compared to 2014.
Strong growth across the board
The Port of New York and New Jersey (PANYNJ) manages the majority of the container trade on the U.S. East Coast, with a total of 6.4 million TEUs handled in 2015. The amount of loaded containers that headed into PANYNJ grew by 9.2 percent in 2015, to a total of 3.2 million TEUs. Despite being the biggest player on the U.S. East Coast, PANYNJ was not the only port to benefit from the growing traffic. Actually, all the ports on the U.S. East Coast experienced strong growth in 2015. The Port of Savannah was the port that experienced the highest growth rate. Rising by 20.4 percent from 2014, 1.6 million TEU loaded containers entered Savannah in 2015.
On the U.S. West Coast, the quantity of loaded containers entering the ports was virtually unchanged at 10 million TEU in 2015, growing only 0.4 percent from the previous year. One of the primary reasons for the low growth was the labor dispute, in addition to the subsequent port congestion.
The conflict reached its pinnacle in January and February. The number of inbound containers dropped by 26.7 percent in January, from 821,000 TEU in 2014 to only 602,000 in 2015. When the dispute was settled, trading quickly resumed and the inbound containers in March were nearly 40 percentt higher in 2015 compared to 2014. However, most of the increase in March came from the ships already anchored by the coast.
What about exports?
Contrary to the growing quantity of containers coming in to the U.S., the situation was different for outgoing containers. While more and more loaded containers were coming in, most of them were leaving empty. And the U.S. West Coast ports were hit the most in this respect. Only 4.9 million TEU of loaded containers left a U.S. West Coast port. This was a drop of 10.2 percent compared to 2014. On the U.S. East Coast, 5.2 million TEU of loaded containers were exported in 2015. A slide of 0.4 percent when compared to 2014.
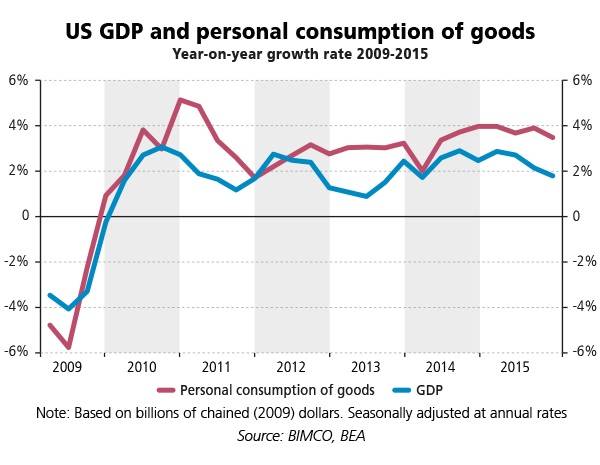
The declining commodity prices – with oil being the biggest game changer here – have increased the purchasing power of American consumers. This increase in disposable income boosted personal consumption of goods in 2015. As measured by the year-on-year quarterly growth rate, personal consumption expenditure, compiled by the U.S. Bureau of Analysis, grew more than GDP in 2015. Personal consumption of goods affect the container trade and the increase in inbound containers to the U.S. in 2015 was impacted by the rise in personal consumption in the U.S.
Sand added, “Despite two consecutive years of double-digit growth at U.S. East Coast ports, it is important to note that the U.S. West Coast ports still handle more volume.”
“The U.S. West Coast ports handled 56 percent of the inbound loaded containers in to the US, according to BIMCO’s data in 2015, but have declined since 2012/2013 where 60 percent of the business was handled by the U.S. West Coast ports,” Sand said.
“Due to the expansion of the Panama Canal and the lower fuel costs brought about by the lower oil price, we expect to see even more of the Asian imports head towards the U.S. East Coast ports. These ports are currently preparing to cater to ultra-large containerships in the near future.”