Will Container Shipping Woes of the 2010s Repeat?

Reduced volumes are currently posing a major challenge to container shipping due to the COVID-19 crisis. So far, freight rates have been held up by the massive blanking of sailings that carriers have put in place.
However, even before this crisis, the container shipping industry was saddled with overcapacity carried over from the previous decade, a problem that will rise again due to the demand fallout from the COVID-19 pandemic.
To understand the challenges that the container shipping market will face in the coming years, it is useful to provide some context and take account of market developments over the past decade.
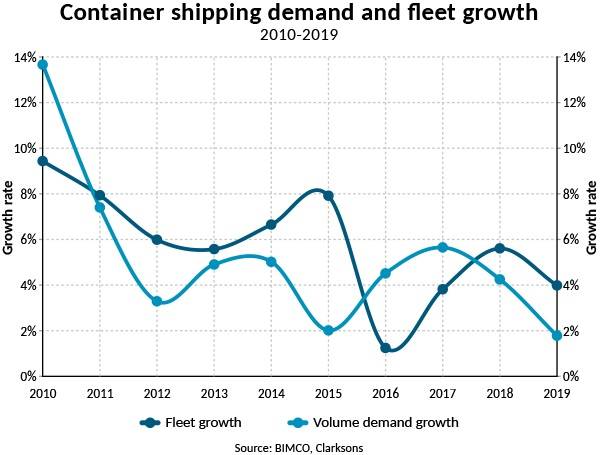
In the last three years of the past decade, demand outgrew the fleet, giving a much higher supply growth than that of demand: the TEU capacity of the fleet grew by 75.6% whereas demand measured in volumes was up 46.1%. This imbalance left the container shipping market in a worse condition at the end of the decade than at the start.
“As in the other shipping sectors, the past decade saw a worsening of the fundamental balance in the shipping market. This led to a challenging outlook even before the COVID-19 crisis. With demand set to fall this year, while the fleet continues to grow, 2020 will prove a painful year for carriers, even if freight rates are held up by record high container ship idling,” says Peter Sand, BIMCO’s Chief Shipping Analyst.
Far East exports account for half of global growth
The 46.1% growth in container shipping volumes, translates into an extra 78.2 million TEU being shipped, bringing the world seaborne container trade to 196.6 million TEU in 2019. Growth in TEU-miles was slightly slower than that in volumes, achieving 38.7% growth between 2010 and 2019.
While there were solid growth rates in many parts of the world, in volume terms, the highest increases came, not surprisingly, from Far Eastern exports which rose by 39.3 million TEU to reach 112.7 million TEU in 2019. The major importers: namely Europe and North America saw strong growth, up by 7.4 million TEU and 8.8 million TEU, respectively.
Volumes grew year-on-year throughout the decade, though the growth rate came down considerably from the start of the decade. The strongest growth came in 2010, at 13.7%, while the lowest growth was experienced in 2019 at just 1.8%. For comparison, in those same years, the fleet grew by 8.5% and 3.3% respectively.
Fleet becoming increasingly polarized
On the supply side, the overriding story of the past decade in container shipping is that of the ever-increasing ship sizes in pursuit of economies of scale. At the start of the decade, the largest container ships were officially a series of three MSC sister ships with a capacity of 13,800 TEU. However, the Emma Maersk was in fact the largest. Although its capacity was reported at 13,500 TEU when delivered in 2006, she in fact has a capacity of 17,816 TEU.
At the end of 2019, the largest ships were a series of 11 MSC ships with a capacity of 23,700 TEU. The continued growth of these ships, not only in their size, but also their number, reflects the increasing use of the hub and spoke network model, with owners focused on expanding their feeder and ULCS fleets, while the middle ship sizes (3,000-14,999 TEU) have become less popular.
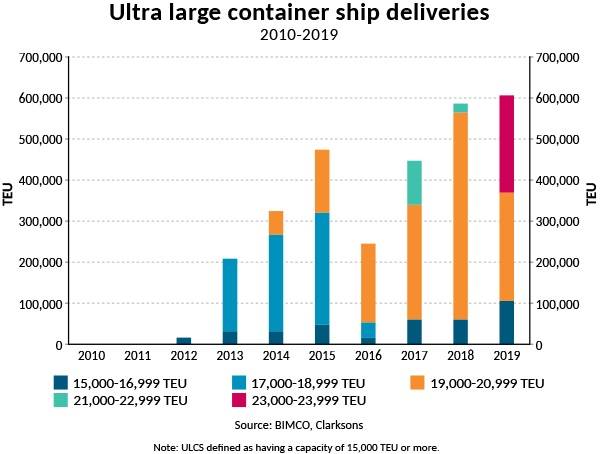
In fact, splitting the decade in half, the only container ship sizes which saw more contracting activity in the five years from 2015 to 2019 than between 2010 and 2014 were ULCS of 15,000 TEU or more, as well as feeder ships (100-2,999 TEU).
Compared to the first half of the decade, orders here were up 119.3% and 66.7% respectively. Contracting for ships between 3,000 and 7,999 TEU fell by 81.3% in the second half of the decade and a 71% drop was recorded for ships with a capacity of between 8,000 and 14,999 TEU.
The increasing container ship sizes have led to investments in ports, cranes and maritime infrastructure around the world to allow the facilities to accommodate these larger ships. Examples include the expansion of the Panama Canal and the lifting of the Bayonne Bridge in New York/New Jersey, which have opened more U.S. East Coast ports to these ships. Even these expansion projects however are not always enough to accommodate for the fast pace increases in container ship sizes: even after the lifting of the Bayonne Bridge it only fits a ship up to 18,000 TEU.
Over the ten years, the fleet grew by 75.6% to reach 22.96 million TEU by the end of 2019. The share of the fleet capacity made up by ULCS (15,000 TEU+) rose from 1% to 13%.
Freight rates stagnated towards the end of the decade
Both contract and spot container shipping rates peaked at the start of the decade with the Shanghai Containerized Freight Index (SCFI) and China Containerized Freight Index (CCFI) averaging 1,362.4 and 1,132.8 in 2010, respectively. The SCFI covers spot rates for exports from Shanghai, whereas the CCFI also includes longer term contracts from a broader range of 10 Chinese export ports. Both bottomed out in 2016 and recovered in 2017, but from then to the end of the decade, freight rates stagnated. In 2019, the SCFI was 2% higher than in 2017, whereas the CCFI had fallen by 0.5%. Compared to 2010, the indexes had fallen by 40.5% and 27.3% in 2019.
The deliveries of up to 30 ULCSs a year in the latter part of the decade has left a shadow of overcapacity over the market, limiting the potential growth for freight rates, and highlighting the importance of cost cutting. The fact that many of these ULCS are very limited as to which trades they can be deployed on due to their size, means that these trades are faced with continuous additions of unneeded capacity and the smaller Neo-Panamax and intermediate container ships are pushed onto secondary trade lanes.
“The stagnation in freight rates towards the end of the decade is testament to the pressures the container shipping market is facing. The focus on cost cutting that has been prevalent in recent years will continue as ULCS, able to offer a lower cost per TEU than smaller ships, continue to be delivered in the coming years,” says Sand, adding, “For a ULCS to deliver its promised economies of scale, it needs to be able to fill up its slots. This has proven difficult due to the crises and may well continue in the future, with fleet utilization likely to remain under pressure.”
The past decade brought increasingly challenging market conditions with more cutthroat competition, overcapacity and greater consolidation of the main carriers. Major cost reductions were leveraged through the unrelenting pursuit of economies of scale.
But as nominal fleet growth exceeded demand growth in most of the years, the freight rates came under mounting pressure, eroding operating margins of container carriers.