

Container Shipping: New Networks in Focus


 File photo: Hapag-Lloyd
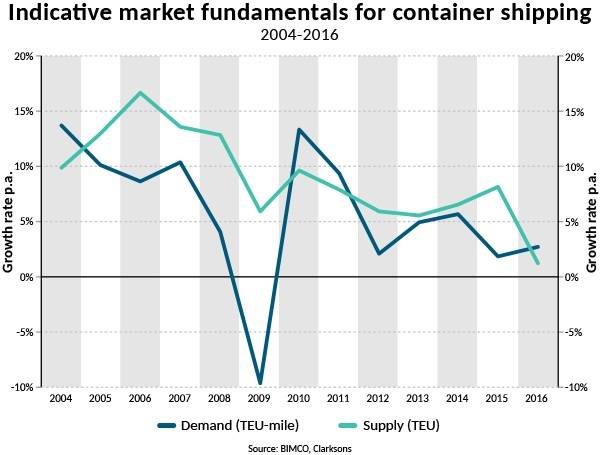
 Indicative market fundamentals for container shipping (Source: BIMCO, Clarksons)
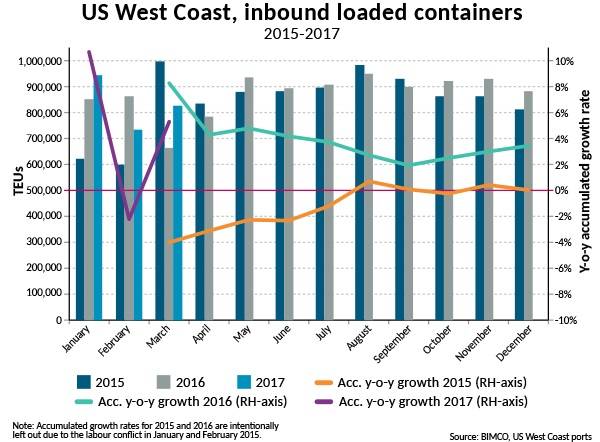
 US West Coast, inbound loaded containers (Source: BIMCO, US West Coast ports)
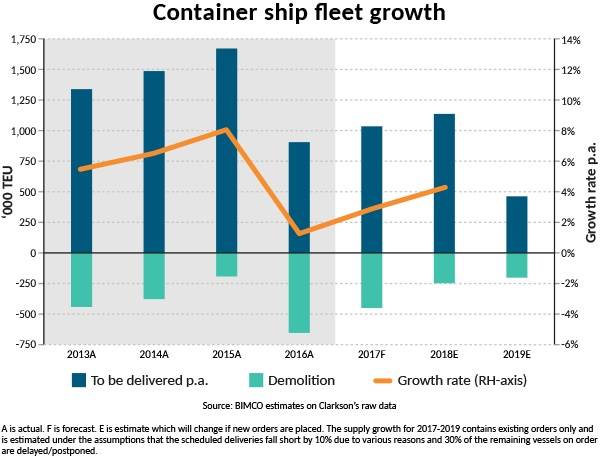 Containership fleet growth (Source: BIMCO estimates on Clarksons' raw data)
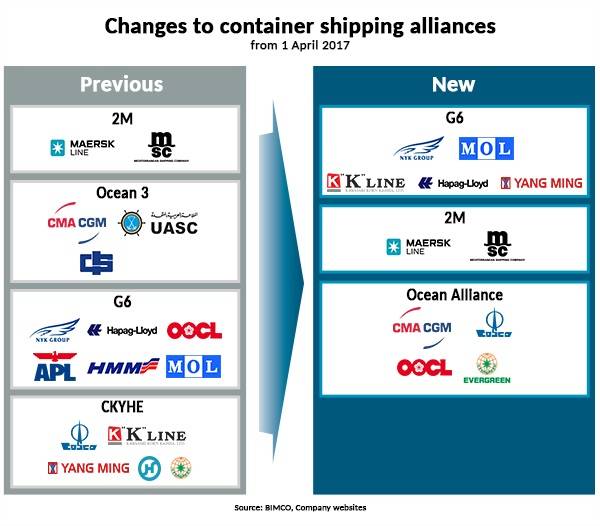
 Changes to container shipping alliances (Source: BIMCO, company websites)

Container shipping: new networks come into focus as the supply side holds the key to improvements
Demand
The most recent available data show that demand for the container shipping grew by 2.7 percent in 2016. With the supply side growing by only 1.3 percent, this meant that the fundamental market balance improved for the first time since 2011. This development is primarily due to decisive actions by ship owners who sold excess tonnage for demolition. Hopefully, improved earnings will also follow soon.
The metric-ton-mile demand side has grown by an average of 3.4 percent annually during 2012-2016. This is a new and lower growth level that has taken some time for the industry to get used to. Every year in which the supply side outstrips the demand side, the fundamental market balance worsens. 2016 was the one year that was different to the previous four years.
Not only is the demand for transportation of containerized goods higher than its most recent low in 2015, but the demand for shipping capacity appears to have altered. What have changed a lot since our last container shipping market report, which was only three months ago, are the charter rates. For many small to medium sized ships, they have gone up sharply since mid-February. Nevertheless, the reasons behind the better charter rates seems to be less clear.
2017 appears to have started well on most trades, although the Chinese New Year notoriously affects the individual data for the first two to three months.
The growth rates on other trades may need to include March as well, to show the real trend. BIMCO’s own U.S. West Coast growth indicator shows a drop of 2.2 percent on a year-on-year basis for the combined months of January and February. Whereas BIMCO’s own U.S. East Coast growth indicator of the same shows a growth rate of 9.4 percent. In total, U.S. imports of loaded containers went up by 2.8 percent.
Meanwhile Container Trade Statistics (CTS) reports a 5.2 percent growth in volumes on the Far East to Europe trade in January and a -9.2 percent drop in February. In total, demand fell by -0.9 percent.
Supply
Since March 2016, the container ship fleet has reduced in size by 100 ships. The strong trend of large ships being delivered and smaller ships getting demolished has meant that the TEU capacity of the fleet has increased by 40 percent since the start of 2011. At the same time the number of ships has only increased by 3.3 percent.
As the fleet is being split into main liners and right-sized feeders, abundant capacity is being removed among the smaller-than-3,000-TEU feeder ships and the narrow beam (panamax ship fleet).
In the past four years, more than 800,000 TEU of narrow beam (<32.3m) panamax ship capacity has been removed. This is equal to half of all demolished container shipping capacity during that time. Nevertheless, the total fleet still holds 3.2 million TEU of narrow beam (<32.3m) panamax capacity (16 percent of total capacity). This is down from 3.9 million TEU (24 percent of total capacity) four years ago.
Not many ships were ordered in 2016 – and that trend has continued into 2017. So far only eight ships have been ordered, all at Chinese shipyards and small (1,750-2,150 TEU).
The order book still contains 3 million TEU that is yet to be delivered, of which 86 percent is scheduled for delivery in 2017 and 2018. 80 percent of the capacity scheduled for delivery in 2017 will come in the form of 9,400+ TEU ships. The cascading of ships onto alternative trades will thus continue at an unchanged pace.
BIMCO expects the container ship fleet to grow by 2.9 percent in 2017, under the assumptions that 450,000 TEU will be demolished and 1 million TEU will be delivered. For that to happen, the current demolition interest must cool somewhat and the delivery pace must pick up. Nonetheless, both assumptions are likely to happen in a market that is improving. In fact, it is already happening.
Currently the fleet is getting smaller by the day, as 152,800 TEU has been delivered in 2017, offset by as much as 195,555 TEU being sold for demolition. This means the fleet is smaller today than it was at the start of the year.
As of April 3, 2017, the idle fleet stood at 0.97 million TEU, according to Alphaliner (4.8 percent of total fleet). This is a sharp decline from close to 1.6 million TEU at the start of the year. All container ship sizes have seen the idle fleet decline. Most significantly, the 3,000-6,000 TEU segment had 130 idle units’ half a year ago, which had become 58 units by early April.
Outlook
The year has started on solid ground, in terms of both the development of the demand side and the ongoing work on keeping the lid on fleet growth. 2016 proved to be a year of upheaval. Most alliances were broken up to form new ones; one line went bankrupt, and in combination, ship owners managed to cut deep into the excess capacity of the fleet. Gains from a low-fleet supply are instantly reaped, whereas the benefits from new network structures take a bit more time.
BIMCO expects the container shipping industry to continuously optimize networks and make them more efficient. Cutting costs where it’s still possible and making the most of the fleet available remains essential to reaping the benefit of the individual alliance members. As cost cutting is a huge part of this, the effect on freight rates is not the only indicator of a successful implementation.
Above all, the implementation of new alliances remains the one thing to watch carefully in 2017. As four alliances consisting of 16 companies, become three alliances consisting of 11 companies, change will happen. The three alliances control 77 percent of global container ship capacity and as much as 96 percent of all east-west trades.
Before getting carried away, we should remember that 57 percent of all demand, as measured by TEU miles, is generated by non-east-west trades – trades that are particularly impacted by the recent years’ cascading of tonnage from the east-west trades. Another two-tier market is in the making.
The Author
Peter Sand is chief shipping analyst at BIMCO.


