Managing Ice Jams
April showers may bring May flowers, but spring can also bring ice jams to the thawing rivers and streams across the northern United States.
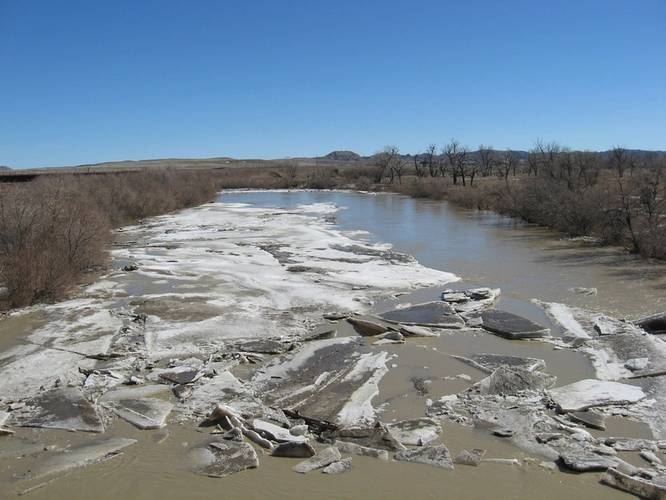
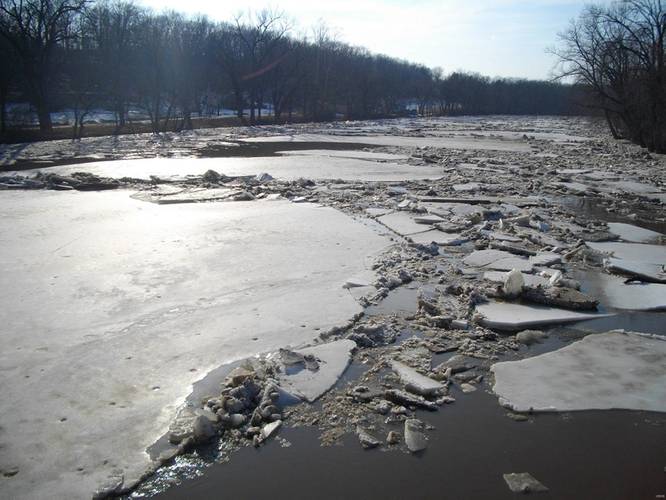
An ice jam or ice dam, is a buildup of broken ice in the river system. It can be a problem that causes the water to back up over the top of highway bridges, roads, or into cities. At times, they can cause flooding. Ice jams can be large–backing up water for miles, or small and only back up water in a small area locally.
An ice jam can damage bridges with the amount of water pushing on the jam from behind; it can force the ice to push the bridge – moving it slightly.
USGS monitors ice jams across the north using cameras as well as by collecting ice thickness information when technicians do regular streamgage work or when measuring discharge on the rivers in the spring.
For example, each year, the Maine Emergency Management Agency and U.S. Coast Guard asks the USGS to measure the ice thickness and provide an ice jam flood potential on the Kennebec River. The U.S. Coast Guard has used their ice breakers to clear the ice in the lower Kennebec River in years when the ice jam flood potential was high.
Greg Stewart, data section chief for the USGS New England Water Science Center, said its part of the agency’s job to monitor river flows throughout the state of Maine and to measure the stream flow underneath the ice.
USGS technicians take ice cores to measure ice thickness at various places on the rivers. In order to make an ice measurement, it’s necessary to drill between 25-30 holes in the ice. Then, thickness is recorded at just several of the holes to help document the measurement conditions.
That information allows the USGS to assess the risk of ice jams, flooding or other problems when the ice begins to melt, Stewart said. According to Stewart, when ice jam flooding starts to happen, there is very little time and very little warning.
Thickness of the ice and how fast a melt occurs affects the ice jam flooding potential. For example while the weather is cold, and the water is freezing you have ice accumulation. When the weather changes and it starts to warm the ice begins to melt and begins to break up. A quick warmup with the ice strong and still in place can cause significant ice jam flooding.
Another sign of spring is the melting snowpack, which is the result of accumulated layers of snow with generally more at high altitudes. Snowpacks feed rivers and streams providing an aquatic life habitat, hydro power, a possible source of drinking water, but they are also a potential flood hazard.
With a quick warm up of high temperatures over a short period of time, there is an increased likelihood of flooding from snowpack melt, but when you have a gradual increase in spring temperatures with moderate temperatures during the day and slightly below freezing at night the flooding potential is decreased slowly and safely.
According to Stewart, when the snowpack starts to melt historically March, that’s when snowmelt driven runoff begins, the USGS looks at the flooding potential.
usgs.gov


